
How to Win Big with 24% Success Rate
45sThe counterintuitive idea that a strategy losing 76% of the time can be profitable due to high payoff is shocking and educational, sparking curiosity.
▶ Play Clip"Title accurately describes a strategy that loses often but wins big when right, backed by 3000+ trades."
This video presents a trading strategy for the mini-index using the Don Xan channel and three moving averages on a 15-minute chart. The strategy has a low win rate (around 24%) but achieves profitability through a high payoff ratio, targeting 100 points with a 300-point stop loss, and includes a mechanism to move the stop to breakeven after a 300-point profit. The presenter backtests the strategy over 10 years and shows how adjusting target and stop parameters can improve the equity curve.
Uses Don Xan channel (period 20, offset 1) and three exponential moving averages (20, 50, 200) on a 15-minute mini-index chart. Operates from 10 AM to 4 PM.
A candle closes above the upper Don Xan channel line and above all three moving averages. Entry at next candle open, target 100 points, stop loss 300 points.
If any candle closes with a profit >= 300 points, the stop is moved to breakeven, eliminating risk.
A candle closes below the lower Don Xan channel line and below all three moving averages. Entry at next candle open, target 100 points, stop loss 300 points.
Success rate of 24% but payoff of 3.46. Backtest from 2015 shows 2,908 trades, profit factor 1.41, low drawdown of 4.89%.
Increasing target to 1000 points raises win rate to 28% with risk-reward 2.79. Reducing stop to 200 and target to 2500 gives payoff of 5, win rate 18%.
Setting breakeven trigger to 50 points, target 1500 points, stop 200 points yields payoff 5.13, drawdown 5.81%.
The strategy is trend-following and does not work for scalping; equity curve becomes poor with short targets.
This trend-following strategy is profitable despite a low win rate because of a high payoff ratio. Parameter optimization can improve performance, but it is not suitable for scalping.
What are the three moving averages used in this strategy?
20, 50, and 200 closing exponential moving averages.
00:42
What is the Don Xan channel period and offset?
Period 20, offset 1.
00:28
What are the trading hours for this strategy?
From 10 AM to 4 PM.
01:10
What is the buy signal condition?
A candle closes above the upper Don Xan channel line and above all three moving averages.
01:39
What is the sell signal condition?
A candle closes below the lower Don Xan channel line and below all three moving averages.
03:09
What are the default target and stop loss?
Target 100 points, stop loss 300 points.
02:09
When does the robot move the stop to breakeven?
When any candle closes with a profit greater than or equal to 300 points.
02:24
What is the success rate of the default strategy?
24%.
04:39
What is the payoff of the default strategy?
3.46.
04:39
How many trades were in the backtest from 2015?
2,908 trades.
05:08
What is the profit factor of the default strategy?
1.41.
05:08
What is the drawdown of the default strategy?
4.89%.
05:08
Does this strategy work for scalping?
No, it is a trend-following strategy and does not perform well with short targets.
08:09
Low Win Rate, High Payoff
Illustrates that a strategy can be profitable despite a low win rate if the payoff is high enough.
04:39Breakeven Mechanism
A key risk management technique that eliminates risk after a certain profit threshold is reached.
02:2410-Year Backtest Results
Provides concrete statistics (2,908 trades, profit factor 1.41, drawdown 4.89%) demonstrating long-term viability.
05:08Scalping Incompatibility
Highlights the importance of matching strategy type to trading style; trend strategies fail in scalping.
08:09[00:02] strategy using the Don Xan channel with three moving averages. This is a 15-minute chart of the mini-index since 2015.
[00:15] indicators: three moving averages and the Don Xan channel. You will right-click on the chart and select the "insert indicator" option. Once he opens the indicator box for you, you will
[00:28] the indicator box for you, you will search for the Don Xan channel indicator. And then he's going to put this indicator here on his chart , see the Don Xan channel. In the properties, you will configure it for period 20 with an offset of one. Just
[00:42] click OK. In this setup, we will also use a 20-closing exponential moving average , a 50-closing exponential moving average, and a 50-closing exponential moving average, and a 200-closing exponential moving average. These will be
[00:56] the indicators used for this strategy. This setup here is the traditional type. When they win big, they win a lot; when they lose, they lose little. This strategy will operate on the 15-minute chart of the mini-index, both
[01:10] buying and selling. As I'm going to show you now, this strategy works from 10 AM to 4 PM. Within this operating range, the setup can perform buy or sell operations. And
[01:25] here I have an example of a purchase in the chart . This is a candle from the 15-minute chart, and it's the 10- hour candle. Based on this candle here, the strategy can already execute buy and sell operations. In the case of
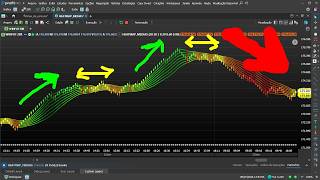
[01:39] purchase transactions, we will have the following. Whenever I have a candle closing above the upper Don Chancen line and the candle's close is above the three moving averages, then I have a perfect buy signal. Look closely, this
[01:54] closure was larger than the top line of the Chant Channel. This closing price was higher than the 200-point average. This closing price was higher than the 50-point average. And this closing price was higher than the 20-point average. The moment
[02:09] the robot identifies this happening on the chart, it will enter the market at the opening of the next candle, and when it enters the trade, it will position a target of 100 points and a stop loss of 300 points. And we're going to
[02:24] have a very important detail here. When a candle closes showing a profit greater than or equal to 300 points, this robot pulls the stop to break even. In this case , you can see that this candle was showing a profit of 949 points. This
[02:40] is greater than 300 points, which was the parameter selected for the robot to pull the stop to break even. It completely eliminates the risk of the operation. This robot will do that, and it will now wait for the
[02:53] target to be executed or for the price to return and exit at breakeven. Let's take a look here. He went there and hit the target. In this case, the target is 100 points, as you can see there. 1900 will these strategies work ? Selling is the opposite of buying. It's
[03:09] very simple. A break in the lower line of Don Chantaniel is necessary. As you can see here, this is the bottom line of Don Chantaniel. And this candle here was breaking through this lower line. Along with
[03:22] that, you realize that the closing price of that candle was below the three moving averages. And once that candle closes, confirming all of this, the robot will send a market sell order. Right at the opening of the next candle,
[03:35] as soon as that candle opens, he enters the market and will position a stop loss of 300 points, with a target of 100 points. And if any candle closes, giving a profit greater than or equal to 300 points, it will pull the stop to the entry point,
[03:52] completely eliminating the risk of the trade. How was it here? Look, let's see here. This candle here has already yielded a profit of 952 points. From that moment on, when that candle closes, showing that profit, the robot will analyze it and
[04:08] realize that there is already a profit greater than or equal to 300 points in the operation. Then, he pulls the stop to the break-even point, completely eliminating the risk of the trade, and waits for the target to be executed or for the price to return to the
[04:24] entry point. But in this case, the target was hit, and we had a profitable operation. In this case, this strategy is a traditional strategy with a low success rate. We have a success rate of 24% here. What makes
[04:39] this strategy profitable is the payoff. We have a payoff here of 3.46. This can be seen in the operations chart. This is the type of strategy where when it's right, you win big, and when it's wrong, you lose little.
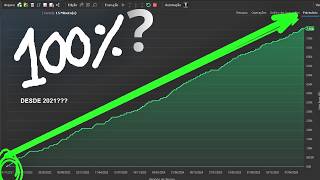
[04:53] capital curve over time. As you can see here, this is a backtest that goes back to 2015. That's more than 10 years 2,908 transactions with a profit factor of 1.41 and
[05:08] a low balance of 4.89%. And here you can see the list of operations for the strategy. Look, here you have the zeroed-out operations. Here you have the stop-loss orders and the targets that were reached. Look , these are sequences here of orders
[05:22] executed from 0 to 0, target hit, right? In some situations, the target will not be reached, nor will the stop-loss be triggered, and then the robot ends up exiting at the end of the day. And it's possible to make modifications to the robot here. Look, we can modify
[05:36] target of 1000 points here, I'll be able to increase the robot's hit rate again. I set a target of 1000 points. He's still at a 300- point stop loss. Let's see what the capital curve looks like. Look here, can you see?
[05:50] can see that the capital curve has been let's see how it turned out here. We're here with a 28% success rate and a risk-reward ratio of 2 to 1, almost hitting 3 to 1, okay? 2.79 with a
[06:04] hitting 3 to 1, okay? 2.79 with a profit factor of 1.35, the low endowment of 4.61. And here is the chart of the operations. We can make another type of modification. For example, let's put a larger target here , a target of 2,500 points. Then I
[06:17] 'll reduce the stop loss to 200 points. Let's take a look here. I'm running it so we can see how it turns out there. By making this modification, setting a stop loss of 200 equity curve ended up like this. And we have a payoff of five here, okay? With
[06:33] a risk-reward ratio of five to one, which is quite interesting, despite having a one, which is quite interesting, despite having a success rate of only 18%. Here we have 3.30 operations with a profit factor of 1.36 and a low balance of 6.50. Look how
[06:46] interesting this is, the chart of operations. When you compare the size of the profit bars with the size of the loss bars, it's quite interesting to see the discrepancy between them, isn't it? The profit bars are
[06:59] much larger and the loss bars are much smaller, and the capital curve is upward sloping. Let's also set a target of 3,000 points here and see how that goes. Look, I set a target of 3,000 points, a stop loss of 200 points, and the
[07:13] equity curve continues to rise. The risk-reward ratio remains five to one, right? As you can see here, the drawdown is 7.83%. We're going to make an interesting adjustment here. I will eliminate the risk of the
[07:26] operation by 50 points. As soon as a candle closes, giving a 50-point profit, I will eliminate the risk from the trade. I'm going to put a target of 1500 points here. Let interesting! The capital curve is steeply upward sloping, as you can see. It went through
[07:41] a period of lateralization here, look. It remained sideways for quite some time, but you can see that this setup has managed to push the capital curve higher here in the pack test. And here are these statistics. Here it is with a payoff of
[07:53] 5.13. That's pretty interesting, isn't it? With a high payoff, the very high payoff of this strategy is 5.81% and the capital curve is ascending. Let's strategy in a scalping format. This isn't a scalping setup, is it? This isn't
[08:09] test it here to see how this strategy performs in a scalping format. It probably won't work because this is a trend setup. Look here, in the scalping format, you can see that the equity curve
[08:22] didn't turn out well, precisely because the entry point for this strategy isn't a programmed entry point for scalping, right? It's a generic entry point that seeks to enter a trend and uses the stop-loss order as a
[08:36] tool to exit the trade if that trend doesn't materialize, right? It's not a particularly effective entry point . You can see here that with 50 target points, he even manages a pretty high hit rate of 90%. But
[08:49] this is purely because of the short target. This strategy is a traditional one that seeks to enter the trend, and therefore it is necessary to use a short stop and a long target so that this setup can produce an
[09:02] time. Receive the channel's various strategies. There are dozens of open-source codes that you can use freely in your profit chart. Enroll today and receive, in addition to various setups,
[09:17] complete training teaching you step-by-step how to create strategies in the Profit [music] Chart editor. And best of all, when you enroll, you get access to our support group, where we share various codes and
[09:30] create several strategies based on your feedback. Do you need to program a music setup and don't know how? Through our support service, we create the code for you. Enroll today and get access to
[09:43] all of this right away. We share the setups with 100% open source code. You can request an unlimited number of codes throughout the two months of support. You will learn from scratch how to set up various
[09:57] trading systems and obtain statistics to discover winning strategies. A training program designed to teach traders to be more than just ordinary investors; they should develop new strategies for the
[10:10] new strategies for the stock market.


⚡ Saved you 0h 10m reading this? Transcribe any YouTube video for free — no signup needed.