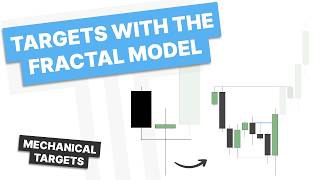

How to Set Targets in the Fractal Model
45sThis segment introduces the core concept of target setting, making it educational and perfect for viewers seeking trading knowledge.
▶ Play Clip"The title promises a clear explanation of targets in the fractal model, and the video delivers exactly that with multiple examples and practical tips."
This video explains how to determine price targets within the fractal model, a trading methodology that uses higher timeframe candles to identify key levels. The core principle is to focus on previous candles' highs and lows on the higher timeframe to set targets for trades entered on lower timeframes, enabling better risk-reward ratios by holding runners to higher timeframe objectives.
When determining targets in the fractal model, focus on the higher timeframe candles you are referencing, not the entry timeframe. The targets are simply the previous candles' highs (for bullish) or lows (for bearish) on that higher timeframe.
Higher timeframe targets tell you where you can hold your trade to. By aligning lower timeframe entries with higher timeframe targets, you can take profits at short-term targets and hold runners to higher timeframe objectives, improving risk-reward.
In a TradingView example, a daily candle 2 closure paired with an hourly change in state of delivery. Targets were marked at previous lows on the daily, which translated to specific levels on the lower timeframe. Price hit the first target, consolidated (a continuation signal), and continued lower.
For intraday trading, focus on the daily chart's previous highs and lows as targets. In a bearish model, mark out previous lows; in a bullish model, previous highs. This simplicity is key.
Higher timeframe targets can also be previous swing highs or lows. For example, on the weekly chart, a swing low becomes a target for a move up. Always focus on swing highs and swing lows as targets.
When a valid swing point forms (e.g., candle 2 closure), look to the left and mark out previous candles' highs or lows that haven't been taken out. These become your targets. Equal lows or highs are especially significant.
If a correlated asset (like silver for gold) takes out a target level, this is an SMT (Smart Money Technique) divergence, which can be considered as the target being hit, even if price hasn't reached it on the primary chart.
By aligning a lower timeframe fractal (e.g., 5-minute) with a higher timeframe fractal (e.g., daily), you can take profits at short-term targets and hold runners to higher timeframe targets, achieving risk-reward ratios like 1:11 or 1:16.
The strategy works when you catch a lower timeframe fractal (candle 3) inside a higher timeframe fractal (also candle 3). This alignment allows you to catch the intraday move and then hold for the higher timeframe expansion.
The fractal model simplifies target setting by using higher timeframe previous highs and lows. By aligning timeframes and using SMT for confirmation, traders can achieve exceptional risk-reward ratios on their trades.
Higher Timeframe Focus
Establishes the foundational principle of the fractal model: targets come from higher timeframe candles, not the entry timeframe.
00:18Risk-Reward Enhancement
Explains how higher timeframe targets enable holding runners for better risk-reward, a key benefit for traders.
01:04SMT as Target Confirmation
Introduces a practical method to confirm targets using correlated assets, adding a layer of confluence.
09:10C3 Inside C3
Provides a clear mental model for aligning timeframes to capture both short-term and extended moves.
11:52[00:00] How's it going everyone and welcome back to another video. In this video we are going to be talking about targets within the fractal model.
[00:18] Let's get into the PDF. So when determining targets within the fractal model, it's actually quite simple. What you are going to do is whatever time frame you are on for entry and whatever higher time frame you are referencing, you are just going to focus on the higher time frame.
[00:33] By looking at the higher time frame candles, that is how you are going to get relevant levels for targets. So you can see here, we have a candle 2 closure, candle 3 looking to expand. What is our target? Well it's just going to be these previous candles lows.
[00:48] So what does that actually look like? Here you can see with a candle 2 closure or a candle 3 closure, what are our targets? Well, here you can see candle 1's high, as well as the previous candle's high, as well as previous candle's highs that are not shown on this diagram.
[01:04] Similar here on the bearish setup, previous candle's lows. So candle 1 low, and the previous lows here. Now, what is the goal of using higher time frame targets? Well, this is telling you where you can hold your trade to.
[01:16] So for example here, if I was on the hourly and five minute fractal model here, here I have an hourly candle two closure. We had our five minute change in the state of delivery inside this wick and looking to trade this candle three continuation higher, we get our interest candle change in the state
[01:32] of delivery and we can be looking for price to trade higher here. Where to? Well, we can look on this timeframe and see the targets. We have a target here as well as a target here. Now that is a great trade alone, but what can we do if we align these targets together
[01:46] or look up to a higher timeframe. Here you can see with the daily candle shown here on the left, we're actually in a candle three expansion on the daily. So we can use that candle one target or the previous candle targets to look for this trade
[02:01] to extend to. This allows me to take a trade looking for my initial or short term targets, but then hold runners to these higher timeframe objectives. This is how you get better RR out of the same trade.
[02:14] So let's go into TradingView and go over a few examples of this. So here we are in our first example and what do we have? We have a candle 2 closure here on the higher timeframe and that is also paired with an
[02:27] hourly change in this to the delivery. If we're on the daily, we will be using hourly according to the timeframe alignment that I use. So if we are looking for a target on this move lower here, looking for this candle 3
[02:40] to expand lower, what can we look for? We can just mark out our previous lows, right? Which would be this low down here, as well as this low down here. So, applying those to the lower time frame, what do we have?
[02:52] We have this low right here, and then this low right here. Now, I can go ahead and check this by turning on my indicator, turning it back on. Did we mark out the correct targets? And we did, right? So if we look, we're looking for this previous low and this previous low as targets.
[03:08] And so let's see what happens. we go ahead and remove the drawings and let this play out You can see Bryce makes a high expands lower it hits its first target Do we get a retracement or a reversal No we get a consolidation which is a continuation signature and we trade lower
[03:26] For just review, make your targets super simple. If you're on an intraday timeframe or using the hourly chart, focus on those previous days' highs and lows. So here on the daily and hourly chart, I'm going to be looking at those previous days' highs or lows.
[03:40] In a bearish model, it will be lows. We mark out our previous lows and that will be our target for this move lower. So here we are in another example. We have expansion down, taking out some lows, and expansion back up.
[03:54] So we could be looking for this to trade higher. What do we have? We have a candle to closure at a point of interest. So we have this fair value up here. Price has taken out the low and closed back above it.
[04:07] So we could be looking for this to trade higher. Now before we go to the lower time frame, what would be our targets here? Well, we know if we go to the lower time frame we're going to be using the higher time frames for our targets. So we have this high here.
[04:20] Now why am I not making out this previous high? Well it already got taken out here. If we would have had this high higher up, well then we could have marked it out as another target. But since it's already taken out, we just have this level here.
[04:33] Now that is what we have for our short term targets. higher time frame targets can also be our previous highs. So you can see these highs over here. Why would I mark those out? Well on a higher time frame if we go to the weekly from the daily here
[04:46] that's going to be a swing low and then that will be our previous highs. So we're always going to be focused on swing highs and lows or previous candles highs and lows as targets. Go down to the hourly
[04:58] chart here and zooming in here you can see it marks out our previous high or this candle one high in this case as our target. As we let this play ahead, you can see we set our target. And
[05:11] if we go through this target, then we can go look for us to trade to what? Those weekly targets, right? Because it is a fractal concept. You can trade on multiple different time frames. We're going out to the weekly. You can see the swing point here on the weekly. And then when it
[05:24] reverses, where's the targets? That swing high, right? So we'll always focus on swing highs and swing lows in the market. So we can go for another example. Right here we have a swing low forming
[05:37] right here. What is going to be our target? Our swing high for right here. So if we go down to something like the four hour time frame here you can see down here on the four hour time frame that low that we marked out and then our previous high as a target. And then once again it's very
[05:53] simple. It's just going to be a reference to the higher time frame using time frame alignment and that swing high will be your target. So if we're going to see this trade higher, where do we want to see it go? To its target. And there you can see we go and hit our target. Let's get into another
[06:10] example. So here we are on the daily and let's go over a few examples of just finding swing points and their targets. So what do we notice here? We have a candle three closure because candle two didn't close back above this level, but then candle three engulfed it. So where would be the target on
[06:26] this. Well, we find Kendall 2's low. This is where we are trading away from. Play it to the left and we mark out the highs So that is our target for this move And we hit that Now we can refer a new swing point we don have anything we just have a consolidation we trade higher
[06:42] here we have a new swing point what's going to be our target on this well candle two this is where we are trading away from what are we looking to trade towards well these are going to be our targets our previous lows that's our candle one and then our previous low and then you can continue
[06:57] to mark out previous lows right those are all going to be targets especially equal lows like that so that all gets taken we retrace back up there's no valid fractal formation in here
[07:09] here we get another candle two closure where would be the target on this one well candle one we've already taken out the low right but we have these previous lows as targets so you guys see what's
[07:21] going on here every time we have a valid swing point we just look to the previous candles mark out their high or their low and that's the target. So what do we notice here? We run out this whole range. We have a candle to closure. So what is going to be our target on this one? And pause
[07:38] the video if you have to and practice marking it out. But we have our previous highs, right? That's a previous high. This is a previous high. This is a previous high. Now why am I not marking out this high here? Well, it's already been taken out. So I'm focusing on those highs that haven't
[07:54] been taken out. So now we have these targets for the move up. Let's see what happens. And there we take out all those targets. So once again, keep your targets very simple. Whatever time frame you
[08:06] are trading, if you're trading intraday, I like to focus on the daily chart. But whatever the high time frame reference is, those are going to be your targets. Focus on those previous highs and lows. So let's take a look at this example here. What do we have? We have price reaching into a
[08:21] fair value gap over here, a candle to closure. So where would be the targets in this move lower? Our previous lows, right? And those are equal lows, which form a fair value gap. So that's a
[08:33] nice target. Here, we form a new swing. What becomes the target there? Right here and right here, right? And we don't go reach up to this final target, and that's fine. We don't expect
[08:45] it to do that all in one day. That's too much daily range. We want to see how it closes. It closes really weak right here, forming a new candle too. So then what becomes our target for this move?
[08:57] We would expect to reach for this low. Now what is the one point in which case we don't need to see price reach for this target? When there's SMT or a correlated asset takes out this low.
[09:10] So if we take a look at silver here, because we're on gold, you can see silver took out this target. So that allows us to say that the target has been hit or has an SMT. So clean up the drawing once again. With this move higher, back with SMT, what are we looking for or what are we looking
[09:27] to target? The previous highs. So we can mark out those highs there as targets and go down to the lower timeframe. So down here on the lower timeframe, we can go ahead and remove the drawings and you can see those targets will remain there because my indicator is going to go ahead and mark
[09:42] those out for us. So let's see what happens now. We want to wait for this brick to form intraday. And what do we have We have price open low taking out all this consolidation into this gap This protected swing right here is holding that level and then we have a little consolidation and sweep with a candle two closure
[10:04] so zooming in here what would be our target on our lower time frame fractal here and this is what i'm talking about when i'm combining or aligning time frames together we have this candle two here so we we have candle one high. That will be a short-term target, but what is our higher time frame target?
[10:20] Up here, right? So let's go ahead and mark those out, and then we'll go to the lower time frame. So marking those out, let's go down to the five-minute time frame. So down here on the five-minute time frame, we can go ahead and remove these drawings because the indicator will mark it
[10:33] out. And we're a bit late to this, but what do we have? We have a protected swing or a continuation that forms right here in candle 3, which could have been our entry, right? Now on this entry
[10:45] here, we'd be wanting to get 2R to this short-term target, right? So we could either adjust the entry a little to get that 2R, or what can we do? We can look for these targets above here, or those
[10:57] higher time frame targets we marked out. This is how you get really high risk-reward moves, is when you can take off a portion of your position at your short-term target, and then hold a runner to see if it can go to our higher time frame target. Let's see what happens here. There you
[11:13] can see candle four. We go and hit our short term target. So this is where I could take profit on this intraday move and then I could hold runners to see if what. If we did get a trend and we can
[11:25] reach towards those higher time frame targets. So letting this go. You can see price does reach up to those higher time frame targets. So if I was going to let a runner go, this is where I can get
[11:40] a very nice move on a runner. Now, why and how does this work? Well, let's go back to our hourly time frame. If you are catching a lower time frame fractal inside a higher time frame fractal,
[11:52] and this is what I'm talking about when I'm saying trading C3 inside a C3, this is candle free on the daily time frame. We are looking for this to expand. If I align that with a candle free on lower time frame looking for that to expand I can catch that move intraday and then hold to see if
[12:08] this move goes to the higher time frame targets and here you can see it did so if we go back to the lower time frame here and rewind you can see that's where you can get really good risk to reward
[12:20] trades because this runner is going to go hit in this case 1 to 11 or even 1 to 16 which is really great risk reward for a runner. So going back out to the hourly time frame here, let's see what happens
[12:34] because what is our higher time frame target right there. So going back to our daily chart where it all started, what do we have? We have a swing point and why was this our target? Because that is our
[12:47] candle one high as well as our previous highs. So I hope you found this video helpful. If you did, please consider liking and subscribing and go check this out for yourself in your own charts. See if you can practice finding targets on your chart. I'll see you guys next week. Have a good one.
⚡ Saved you 0h 13m reading this? Transcribe any YouTube video for free — no signup needed.