
What is CCI? The Secret Momentum Indicator
45sQuick, clear explanation of a popular indicator that hooks traders looking for new tools.
▶ Play Clip"Delivers exactly what the title promises — a clear walkthrough of CCI with backtest results, no fluff."
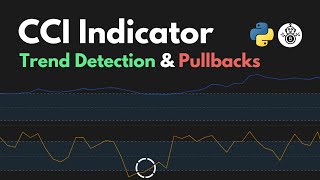
This video explains the Commodity Channel Index (CCI) indicator, covering its calculation, how to interpret overbought/oversold signals, and its use in trend detection. It then introduces a dual CCI strategy that combines a 110-period CCI for trend direction with a 5-period CCI for pullback entries, and presents backtesting results on AVAX-USDT showing a 276.34% profit with a 63% win rate.
CCI is a momentum indicator that compares current price to its average over a set period, using HLC3 (average of high, low, close) for smoothing.
Default length is 20 periods; the indicator line fluctuates around a zero center line.
CCI is unbound, with no fixed minimum or maximum value, allowing flexibility in interpretation.
With shorter periods (e.g., 20), CCI above +100 suggests overbought, below -100 suggests oversold.
With longer periods (e.g., 100), CCI staying above +100 indicates a strong uptrend.
The dual CCI strategy uses a 110-period CCI for trend (above +80) and a 5-period CCI for pullback entries (crossing above -100).
Exits use an ATR-based stop loss and a 2:1 risk-reward ratio for take profit.
Parameters optimized on 8 months of in-sample data, then tested on 4 months of out-of-sample data.
Backtest on AVAX-USDT showed 276.34% total profit, 63% win rate, and 23% max drawdown.
The dual CCI strategy effectively combines long-term trend detection with short-term pullback entries, and backtesting on AVAX-USDT shows strong profitability with a 63% win rate.
CCI is unbound
Understanding that CCI has no fixed limits is crucial for interpreting its signals correctly.
01:38Dual CCI strategy combines trend and pullback
This approach merges two timeframes to improve entry timing within a trend.
03:14Backtest shows 276% profit
Concrete performance data demonstrates the strategy's potential effectiveness.
05:55Risk management with ATR and 2:1 R:R
Emphasizes the importance of structured risk management in trading strategies.
04:02[00:00] In this video, I'll walk you through how the CCI indicator works and how to use it for trend detection and pullbacks. By the end, I'll share the backtest results of the dual CCI strategy.
[00:12] Let's dive in. The Commodity Channel Index, or CCI, is a momentum indicator. It works by comparing the current price of an asset to its average price over a certain period.
[00:24] This comparison tells you whether the price is higher or lower than usual. Now, let's add the CCI indicator to the chart. Go ahead and search for CCI. Choose the Commodity Channel Index from the list of indicators.
[00:39] The default length is set to 20. This means the CCI will compare the current price to the average price over the last 20 periods. In other words, it calculates how much the price is deviating from its average over that time frame.
[00:55] and the source HLC3, which stands for the average of the high, low, and close prices for each period. This provides a smoother view of price action.
[01:07] Now, after adding the CCI to your chart, you'll notice the indicator line fluctuates above and below a center line, which is typically set at zero. When the CCI goes up, it means the current price is higher than the average price over the last 20 periods.
[01:23] When the CCI goes down, it means the current price is lower than the average price over the last 20 periods. One important thing to know about the CCI is that it is unbound, meaning it doesn't have a fixed minimum or maximum value.
[01:38] The CCI can go as high or as low as the market moves giving you flexibility in interpreting its signals Let look at how traders use it to make decisions There are two main things traders look for 1. Overbought and oversold conditions.
[01:52] 2. Market trends. Let's dive into each one and see how it can help you trade. The CCI is most commonly used as an overbought, oversold indicator when traders apply shorter look-back periods, like 20 periods.
[02:07] When the CCI goes above plus 100, the price may have risen too quickly. Traders might decide to sell or wait for the price to pull back before buying again. When the CCI drops below 100, the price may have fallen too far.
[02:22] Traders might see this as a buy signal, hoping the price will bounce back up. These signals give traders a heads-up that the market could reverse soon, allowing them to act before the price changes.
[02:34] Trend Detection When you use a longer look-back period, like 100 periods, the CCI becomes a powerful tool for detecting trends. When the CCI stays above plus 100, it indicates that the market is trending upward.
[02:49] This sustained movement above plus 100 suggests strong, bullish momentum, and traders often interpret this as a sign to consider long positions or continue holding their current positions.
[03:01] The dual CCI strategy Now that we understand how the CCI works, let's dive into the dual CCI strategy, which combines both long-term trend detection and short-term pullback signals.
[03:14] For the long trend we use a 110 This will help us identify the overall direction of the market When the 110 CCI stays above plus 80 it indicates that the market is in a strong uptrend This is the first
[03:32] sign we need to look for before considering a trade. To fine-tune our entry, we'll use a 5-period CCI to detect short-term oversold conditions during pullbacks. We'll watch for the 5-period CCI to dip below negative 100. This suggests that the market is temporarily oversold within the
[03:50] uptrend. Our long signal occurs when the five-period CCI crosses back up to negative 100. This crossover tells us that the pullback might be ending, and it's a good time to enter the trade.
[04:02] For exiting the trade, we'll manage our positions and protect our profits using an ATR-based stop loss combined with a risk-reward ratio of two for take profit. This approach helps us stay in the trade as long as the trend continues, while also setting a clear profit target that's
[04:18] double the risk we're taking. Let's look at another example to make the strategy even clearer. When the 110-period CCI stays above plus 80, it indicates a strong upward trend.
[04:32] Now we wait for the 5-period CCI to pull back to negative 100, and we enter the trade. Then we use an ATR-based stop loss with a 2 to 1 risk-reward ratio for take profit.
[04:44] We can see that it's a winning trade. Now that we've covered how the strategy works, let's talk about how we can optimize the parameters for better performance. I tested the strategy on a one-hour time frame using two periods.
[04:58] First we have the in data which covers eight months This is where we find the best parameters for the strategy Next we move to the out data which covers four months After optimizing the strategy we test it on this period to see if it works well
[05:16] with new, unseen data. To fine-tune the strategy, I focus on these key parameters. The length of both the long and short term CCI. The thresholds for the long and short
[05:28] term CCI, the ATR period multiplier, and the risk reward ratio for the stop loss and take profit. By adjusting these settings, we can make sure the strategy performs at its best.
[05:40] We're going to use FreqTrade, an open source platform designed specifically for crypto trading automation. If you want to see the full tutorial on how to use FreqTrade, check out the link in the description below. Now, let's take a look at the backtesting results.
[05:55] We ran a strategy on the AVAX-USDT pair, and here are the optimized parameters. The total profit is 276.34%, with a 63% win rate.
[06:09] The maximum drawdown is 23%. And if we look at the cumulative profit line, it shows a steady upward trend. You can download the strategy code for further research by checking the link in the description below.
[06:25] If you found this video helpful, make sure to subscribe, hit the notification bell, and share it on WhatsApp, Facebook, or Twitter to support the channel. Thanks for watching and I'll see you in the next one.
⚡ Saved you 0h 06m reading this? Transcribe any YouTube video for free — no signup needed.