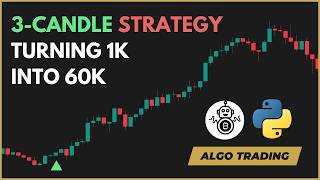

Simple 3-Candle Strategy Turns $1K into $60K
45sThe promise of a massive return from a simple strategy instantly grabs attention and triggers curiosity.
▶ Play Clip"Title promises a simple strategy with impressive returns, and the video delivers exactly that with clear backtest data and code availability."
This video tests a simple trading strategy on Binance Spot using six years of historical data, claiming a $1,000 investment could grow to $60,000. The strategy relies on three consecutive bullish candles and an EMA 200 filter, with exits determined by the Relative Vigor Index (RVGI). The backtest results show a 5,883% total return, outperforming buy-and-hold by more than four times.
The entry signal is three consecutive bullish candles, where each closes higher than it opened, indicating buyer momentum.
Price must be above the 200-period exponential moving average (EMA), and the EMA must be rising, to avoid short-term bounces in a downtrend.
There is no fixed take profit; trades exit when the Relative Vigor Index (RVGI) crosses below zero, signaling a momentum shift.
Tested on FreqTrade with Binance Spot, 8 liquid cryptocurrencies, 8-hour candles, from May 2020 to August 2026 (over 6 years), with max 8 open trades (1 per pair).
807 trades total, 39.41% win rate, average winner held ~12 days, average loser cut in under 6 days. Total return 5,883% vs market return 1,417%.
Profit factor 1.58, Sharpe ratio 0.76, and max drawdown stayed below 20% over the six-year period.
The strategy demonstrates that a simple momentum-based approach, combined with a trend filter and dynamic exit, can significantly outperform the market over the long term. The full code is available for download, and the creator offers a course for building similar strategies with FreqTrade.
Simple Entry Signal
Demonstrates that a basic pattern of three bullish candles can be a powerful momentum indicator.
Trend Filter with EMA 200
Shows the importance of aligning trades with the broader trend to avoid false signals.
00:33Outperformance vs Buy-and-Hold
The strategy returned 5,883% vs 1,417% for the market, highlighting the potential of active trading.
01:44[00:00] In this video, I'm testing one of the simplest strategies I've ever backtested on Binance Spot, across six years of data. The result? $1,000 turned into around $60,000. Here's how the entry works. The trigger is three consecutive bullish candles,
[00:17] three candles in a row where each one closes higher than it opened. That's it. When price moves up for three straight candles, it tells us something simple but powerful. Buyers are stepping in and momentum is building, but three bull candles alone isn't enough. We also check
[00:33] the EMA 200, the 200-period exponential moving average. Price has to be above it, and the EMA itself has to be rising. That one filter keeps us out of short-term bounces inside a bigger downtrend.
[00:46] We only take trades when the big picture agrees. Now the exit. There's no fixed take profit. trades ride until the RVGI, the Relative Vigor Index, crosses below zero.
[00:59] Relative Vigor Index measures whether closing prices are trending higher than opening prices relative to the range of the candle. When it falls below zero, momentum has shifted and we exit.
[01:11] I tested this on FreqTrade with the following setup. Exchange Binance Spot Pairs eight of the most liquid cryptocurrencies Time frame 8 candles Time range May 2020 to August 2026 just over 6 years Max open trades
[01:29] 8, 1 slot per pair. Here's what 6 years of data produced, 807 trades total. Win rate, 39.41%. Average winner held for nearly 12 days, while the average loser was cut in under 6 days.
[01:44] Total return, 5,883%. The market returned 1,417% over the same period. The strategy outperformed buy and hold by more than four times. Profit factor, 1.58. Sharp ratio, 0.76. And the max
[02:02] drawdown stayed below 20% for the entire six-year run. The full strategy code is available in the description below. You can download it and run the backtest yourself. And if you want to learn how to build your own strategies with FreqTrade from scratch, from environment setup all the way
[02:17] to backtesting and running a live system, I have a full course that covers everything step by step. Link is also in the description. If you enjoyed this video, make sure to like it, subscribe to the channel, and turn on the notification bell so you don't
[02:31] miss the next strategy breakdown. I'll see you in the next one.
⚡ Saved you 0h 02m reading this? Transcribe any YouTube video for free — no signup needed.