

I Made €5K in One Trade While Traveling
45sThe promise of a quick, high-profit trade while traveling is highly appealing and curiosity-driven.
▶ Play Clip"Delivers a real trade breakdown, but the title oversells the 'while in Madrid' aspect; still solid content."
The video demonstrates a forex trading strategy that earned over €5,000 in a single trade while the trader was in Madrid recording a podcast. The strategy relies on three key elements: timing, macroeconomic data, and liquidity. The trader explains how they used a 5-minute timeframe, reacted to positive dollar CPI data, and identified liquidity points to execute a profitable trade.
The trader earned more than €5,000 in one trade while in Madrid, relying solely on three things: times, macroeconomic data, and liquidity.
The trader set a maximum of 5 minutes and moved down to this timeframe because positive data for the dollar was released at that moment.
Positive CPI data for the dollar was released, indicating the euro could fall.
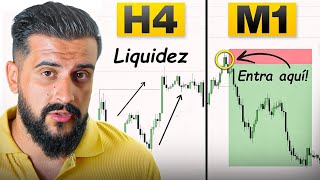
The trader waited for the price to reach a liquidity point, which was also supported by a trend line below the lows.
After price reached the liquidity peak, the trader moved to a 1-minute timeframe to wait for a structure change.
The trader entered on the imbalance (void) left by the price, targeting the next liquidity zone or the lows on the 1-hour timeframe, with a risk-reward of 1:6 or 1:2.
The trade exemplifies a disciplined approach combining macroeconomic news, liquidity concepts, and multi-timeframe analysis to achieve a high-reward trade.
What three elements did the trader rely on for the trade?
Times, macroeconomic data, and liquidity.
00:01
What timeframe did the trader initially use?
5 minutes.
00:14
What macroeconomic data was released that indicated the euro could fall?
Positive CPI data for the dollar.
00:27
What did the trader wait for before moving to a lower timeframe?
The price to reach a liquidity point, such as a peak or trend line.
00:40
What was the risk-reward ratio mentioned for the trade?
1:6 or 1:2.
01:25
Earning €5k in a single trade
Demonstrates the potential profitability of the strategy.
00:01Using CPI data for trading decisions
Shows how macroeconomic news can be integrated into technical analysis.
00:27Entering on imbalance
Highlights a specific entry technique based on market inefficiencies.
01:11[00:01] with Orion Fund and while I was here I was trading and managed to earn more than €5,000 in just one trade. Stay here because I'm going to explain it to you. To take this trade I relied solely on three things: times, some
[00:14] macroeconomic data that had just been released, and liquidity. I set my maximum, in this case of 5 minutes, and I went down to this timeframe because right at that moment some
[00:27] right at that moment some very positive data came out for the dollar. I'll leave it here for you. Look at the green data we had for the CPI in the dollar. Therefore, the euro could fall. Therefore,
[00:40] I waited for the price to reach that liquidity point, and besides, the price had also left me liquidity in the form of a trend line here below these lows. What I waited for was for the price to reach this liquidity point
[00:54] here, this peak, and I moved down to a lower timeframe, in this case to one minute. What you can do here is wait for the price to change its structure, which in this case leaves it here. And then the
[01:11] price, see how it will alleviate this void, this imbalance that leaves us here. You could have posted your entry here to search for sales. And you can place your take profit towards the next liquidity zone, towards the
[01:25] lower lows, or at the lows we have here on the one-hour timeframe. This is what we have here, and you can easily extend it to 1 to 6, or if you don't want to complicate things, just to 1 to 2. And that's the trade I got
[01:41] while I was in Madrid to record a podcast with Orion. Yeah.

⚡ Saved you 0h 01m reading this? Transcribe any YouTube video for free — no signup needed.