
AI Summary
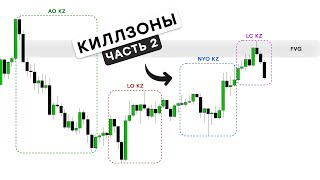
This video is the second part of a series on killzones, focusing on the New York Opening and London Closing killzones. The presenter explains how these periods often produce powerful price movements, especially when previous sessions have left unremoved liquidity and imbalances. Using real chart examples, the video demonstrates how to identify entry points, set stop-losses and take-profits, and emphasizes the importance of time context in trading.
Chapters
Recap of the previous video on Asian and London killzones, and introduction to the New York Opening and London Closing killzones.
These periods often produce powerful movements, especially if previous sessions left significant unremoved semi-liquidities and unbalanced imbalances.
The video works on real examples, explaining price movement, entries, and processing without idealization.
The presenter recommends subscribing to his Telegram channel for real-time examples and a cheat sheet on killzones.
Active from 14:00 to 17:00 ATC+3. Most often, the trend formed in previous sessions continues.
Daily low formed in Asia, aggressive growth began. London killzone produced no significant events. Bearish daily imbalance above acts as a magnet.
Current timeframe's bullish imbalance still not rebalanced. London high is a pool of liquidity in front of significant areas of interest.
Price corrects or rebalances bullish imbalance, then upward movement removes London High and reaches daily bearish imbalance.
After New York killzone opens, London low is removed, bullish imbalance partially filled, bullish order block confirmed. Entry from order block, stop under its minimum, take profit at beginning of daily imbalance.
Price behavior depends on time of day. New York killzone gives clearer reactions to order blocks and higher probability of continued movement.
If RR not suitable, switch to 5-minute timeframe and wait for bullish setup inside order block. Open long from new local order block, stop below, first take at London high, second at daily resistance.
Wait for setup inside upper block, enter on 2-minute timeframe. RR 1 to 4, phenomenal result.
Limit order filled, targets updated sequentially. Opening positions in Asian killzone is harder with lower win rate due to less liquidity and more manipulation.
When no significant movement in Asian/London killzones, key liquidity pulls untouched. Key resistance zone above, expect continuation of downward movement.
Could open short immediately or wait for setup on lower timeframe. Price updated daily low and reached target.
Most pricing options during this period, depend on previous sessions' price behavior.
Day's high formed, active decline. Asian low lifted at London opening. Day's low formed, upward movement began. 15-minute imbalance is key target.
Removal of local liquidity, partial rebalancing of imbalance. Typical correction from New York opening, turned into impulsive growth. Current high is half-liquidity, not a turning point.
Expect correction into bullish imbalance and continued growth. Avoid deep correction, so limit order with wide stop not rational.
Candle shadow formed by sharp decline removing previous low, then quick growth. Extreme decline in bullish imbalance zone, meets criteria for bullish order block. Long from order block, stop below, take profit at bearish imbalance. RR 2 to 1.
Deal filled and scenario plays out within the same killzone.
Read institutional flow, understand current context, and take into account time factor. These are the three key benchmarks for any strong entry trade.
The video provides practical, real-world examples of trading within the New York and London Closing killzones, emphasizing the importance of time context, institutional flow, and understanding imbalances. By following these principles, traders can improve their entry timing and risk-reward ratios.
Mentioned in this Video
Tutorial Checklist
Study Flashcards (5)
What are the active hours of the New York killzone?
easy
Click to reveal answer
What are the active hours of the New York killzone?
14:00 to 17:00 ATC+3.
00:58
What is the key magnet for price in the New York killzone example?
medium
Click to reveal answer
What is the key magnet for price in the New York killzone example?
The bearish daily imbalance.
01:10
What are the three key benchmarks for any strong entry trade?
medium
Click to reveal answer
What are the three key benchmarks for any strong entry trade?
Reading institutional flow, understanding current context, and taking into account the time factor.
08:36
Why is the New York killzone considered to have clearer reactions to order blocks?
medium
Click to reveal answer
Why is the New York killzone considered to have clearer reactions to order blocks?
Because price behavior depends on time of day, and during New York killzone the reaction to order blocks becomes clearer and the likelihood of continued movement increases.
02:32
What is the risk-reward ratio mentioned for the 2-minute timeframe conservative option?
easy
Click to reveal answer
What is the risk-reward ratio mentioned for the 2-minute timeframe conservative option?
1 to 4.
04:27
💡 Key Takeaways
Time Context Changes Movement Nature
Emphasizes that price behavior depends on time of day, a core principle in killzone trading.
02:32Asian Killzone Lower Win Rate
Provides a comparative insight that Asian killzone has less liquidity and more manipulation, affecting win rates.
04:40Three Key Benchmarks
Summarizes the essential factors for strong entries: institutional flow, context, and time.
08:36Full Transcript
[00:02] part of the video about killzones. Last time we took a detailed look at the Asian and London killzones. We looked at typical price development scenarios on the charts and learned how to use them in an interval. Today we move on to the next
[00:16] pair: the New York Opening and London Closing Kilzones. These periods often produce powerful movements, especially if previous sessions left behind significant unremoved semi-liquidities and unbalanced imbalances. As
[00:30] before, we will work on real examples without idealization or complications. Everything as is, with an explanation of the price movement, entries and processing. And before we continue, I recommend subscribing to my Telegram channel. There I show how
[00:44] everything I talk about in my videos works in real time. A cheat sheet with key information on killzones is also already available there. Link in the description. Subscribe. Let's start with the New York Killzone. It is active from 14:00
[00:58] New York Killzone. It is active from 14:00 to 17:00 ATC +3. Most often, during this period, the trend formed in previous sessions continues. In our case, the daily low was formed in Asia, after which aggressive
[01:10] growth began. The London killzone, objectively speaking, did not produce any significant events. Above, there remains a bearish daily imbalance, which acts as a key magnet for the price. Below is the current timeframe's butchi imbalance, and it still hasn't
[01:24] been rebalanced. And we want to see this to consider the long position. Essentially, the London high and its are simply a pool of liquidity located in front of significant areas of interest. And our task is to wait for them to be removed. The expected
[01:38] scenario for the opening of the New York kill zone will be structured as follows. The price corrects or rebalances the bullish imbalance, after which an upward movement begins, during which the London High is removed and a
[01:50] daily bearish imbalance is reached. To realize our expectation, let's move to a fifteen-minute time frame. Immediately after the New York kill zone opens, the London low is removed, the bullish imbalance is partially filled and the
[02:04] bullish order block is confirmed. This is our support zone, which indicates a possible end to the correction and opens the opportunity to enter a long position. Entry from the beginning of the order block, suplock under its minimum, take profit at the beginning of the
[02:19] daily imbalance. It may seem that in such situations the price often makes several more manipulations, as a result of which the stop-loss is triggered. But here everything is different, because it happens at the right time. It is this factor
[02:32] right time. It is this factor that changes the nature of the movement. Price behavior directly depends on the time of day. At different periods, the structure of the movement and the number of manipulations may differ. New York kill zones are precisely the
[02:45] period when the reaction to order blocks and other areas of interest becomes clearer, and the likelihood of continued movement increases significantly. Let's assume that such RR does not suit us. What can be done in this case? Look for a new deal. To do this,
[03:01] we switch to the five-minute time frame and continue working here. The plan is simple. Inside the order block we will wait for a bullish setup to form. As soon as it appears, we will open a deal based on it.
[03:14] The price receives a different reaction from the order block and forms a new local order block. Lung position opens from its beginning. We put a stop loss under it. First take on the London killzone maximum. Here
[03:29] you can fix about half of the volume. The second take is at the level of the beginning of the daily resistance zone, where the deal will be completely closed. The risk/reward ratio is excellent, but for some this trade may
[03:42] seem too aggressive. So let's look at a more conservative option. The principle remains the same. Inside the upper block, we wait for the setup to form and enter based on it. Let's go to the two-minute timeframe.
[03:56] Here is our urderblock. And on this timeframe it looks non-standard, but this does not diminish its significance, because it was defined on a higher timeframe and, accordingly, remains relevant in this form.
[04:10] the formation of a new local upper bloc. A long position is opened from its beginning. Stop-loss is placed below it, and the profit target is set at the same final target. RR is 1 to de. This is a
[04:27] phenomenal result, and such a painstaking approach justifiably brings high returns. Well, let's look at the results. The limit order is filled and the previously specified targets
[04:40] are updated sequentially. Opening similar positions in Nakillzone is a much more difficult task with a lower win rate. During such periods, there is less liquidity in the market, formations take longer, price behavior becomes less stable, and
[04:54] the amount of manipulation increases significantly. Therefore, always consider not only the price, but also the time. It is the time context that helps us understand when and how the price will move. Now let's look at the situation that is
[05:08] being formed in the New York kill zone by the extreme of the day. This happens in cases where there has been no significant movement in the Asian and London kill zones . But the key liquidity pulls and areas of interest behind them were not touched. Above
[05:22] is the key resistance zone of the Urderbook on a higher timeframe. It is from this point that it is logical to expect a continuation of the downward movement, where the target will be a significant pull of liquidity for sale and a
[05:35] daily imbalance, which acts as a magnet for the price. At this point, the high of the day is potentially formed. We could either immediately open a short position upon testing the zone of interest, or move to a lower
[05:49] timeframe and wait for a setup, as we did before. Let's see what happens next. Within the New York kill zone, we updated the daily low, and then the price reached the designated target. We move on to the last
[06:03] killzone, the closure of London. There are the most pricing options during this period , and they directly depend on the price behavior in previous sessions. Now we'll look at a classic situation, but first, a little context. From
[06:18] formed the day's high, after which an active decline began. The minimum Asian kill zone was already lifted at the opening of London. Thus, the minimum of the day was formed and the upward movement began. The highlighted
[06:33] fifteen-minute imbalance is the key target for further growth, so from the opening of the New York Killzone we would already be considering the possibility of opening a long position. We see a familiar manipulation. First,
[06:45] the removal of local liquidity, then a partial rebalancing of the imbalance. This is a typical correction from the opening of the New York kill zone, which turned into an impulsive growth. However, the current high is simply half-liquidity. It has no
[06:59] basis to become a turning point. The price will continue to rise towards the imbalance because it acts as the primary magnet for the price. Let 's formulate a plan. The London closing kill zone begins at the opening of the next candle
[07:12] . Here we expect a correction into the bullish imbalance zone and continued growth towards the designated target. At this stage, you shouldn't count on a deep correction, so entering with a limit order with a wide stop, say, beyond this
[07:26] low, won't be rational from the point of view. Let's move on to the five-minute time frame. Notice the shadow of this candle and how it was formed. First, the candle opens and sharply goes down, removing the
[07:40] previous moon. Then it starts to grow quickly. Moreover, the extreme decline falls precisely in the zone of fifteen-minute bullish imbalance. This meets the criteria for a bullish order block. And the candle shadow, even despite its
[07:54] non-standard shape, is considered a valid order block. I talked about this in more detail in the video about order blocks. A long position is opened from the beginning of the order block. We place the supplod below it, and take profit at the beginning of the bearish
[08:08] take profit at the beginning of the bearish imbalance. RR is 2 with pono. This is a good result, and if necessary, you already know how to improve it. On the next candle the deal is filled, and all that remains is to wait for
[08:22] our scenario to come to fruition. And we see how the position works within the framework of this same kill zone. As you can see, I have shown the most common scenarios for all killzones that can be used on an almost daily
[08:36] basis. They are easy to implement and easily adapt to any market situation. All you need to do is read Ardro's institutional flow , understand the current context and take into account the time factor. These are the three
[08:51] key benchmarks on which any strong entry trade is built. We'll finish here. If you found this video helpful, please like it, leave a comment, and be sure to check out my Telegram channel. A
[09:04] cheat sheet for killzones is already available there. Link in the description. Good luck.