
What Are Kill Zones? The 4 Key Trading Sessions
45sQuickly defines a core trading concept with actionable timing, appealing to both new and experienced traders.
▶ Play Clip"Delivers a solid, practical breakdown of kill zones with real chart examples, though the title promises 'entry' and the video is more educational."
This video explains the concept of kill zones in day trading, focusing on the four main trading sessions (Asian, London, New York, and London Close) and how to use them to identify optimal entry points. The presenter provides a detailed breakdown of each kill zone, typical price behaviors, and practical examples on cryptocurrency charts, emphasizing the importance of context and session relationships.
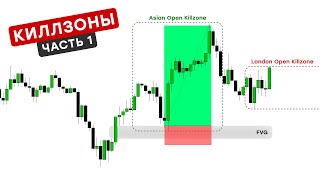
Kill zones are trading sessions with the most market activity, where key manipulations occur and the main movement of the daily candle unfolds. There are four: Asian, London, New York, and London Close.
Starts at 3:00 AM and lasts until 8:00 AM (UTC+3). Usually accompanied by a range or formation of a daily extreme (high or low). Often consolidation, so no trades are opened.
Active from 9:00 AM until lunch. Expect formation of daily extreme if Asia consolidated, or corrective movement into premium/discount. If price consolidates, wait for New York.
From 14:00 to 17:00. Most often observe correction in premium/discount and continuation of trend. Less often high/low formed, especially if London was in consolidation.
From 17:00 to 19:00. Price action depends on previous sessions. Often correction of opposite daily trend, or formation of high/low. Sometimes daily trend reaches extreme and pullback begins.
All times are in UTC+3. Viewers in different time zones must adjust to local time.
During Asian kill zone, market consolidates; London updates lower boundary and forms daily low; New York opens with correction in discount (best long opportunity); London Close corrects downwards (possible counter-trend shorts).
The presenter analyzes each kill zone on real cryptocurrency charts, showing typical scenarios and how to use them daily.
If price consolidates, no positions. Expect daily extreme to form within Asian zone. In bullish context, expect daily low. Use imbalance and order block for long entries, with targets at Asian high and previous day high.
Context: range-bound market. W formation confirmed. Plan: wait for correction to order block for long, or short if upper boundary updated. Example shows short entry at order block, with stop-loss and take-profit at Asian low.
If low formed in Asia, expect correction in discount to OTE zone. Use breaker block and order blocks for long entry. Example shows trade completed within London kill zone with 1:4 risk-reward.
Understanding standard scenarios and session relationships helps create clear trading plans. Next video will cover New York and London Close kill zones in detail.
Mastering kill zones allows traders to anticipate price movements and enter trades with optimal timing. The key is understanding how sessions interact and using context to form daily trading plans.
What are the four kill zones in day trading?
Asian, London, New York, and London Close.
00:17
What is the typical time range for the Asian kill zone (UTC+3)?
3:00 AM to 8:00 AM.
00:17
What is the typical time range for the London kill zone?
From 9:00 AM until lunch.
00:46
What is the typical time range for the New York kill zone?
From 14:00 to 17:00.
01:15
What is the typical time range for the London Close kill zone?
From 17:00 to 19:00.
01:43
What should you do if the price consolidates during the Asian kill zone?
Do not open any positions.
02:41
What is the typical scenario during the New York kill zone?
Correction in premium/discount and continuation of the current trend.
01:15
What is the significance of the 0.5 level in the Asian kill zone example?
It reflects the fair value of the asset and acts as a price magnet.
04:12
What is a bullish imbalance and how is it used?
A support zone; rebalancing is likely to lead to a price reaction and continued growth, used for long entries.
04:26
What is the W formation in the London kill zone example?
A pattern consisting of Low, Lower High, and another Lower Low, confirmed when key structural high is updated.
05:33
What is the risk-reward ratio mentioned in the London kill zone example?
1:4.
09:49
Definition of Kill Zones
Provides a clear, concise definition that frames the entire video.
00:02Typical Trading Profile
Summarizes the ideal price action across all kill zones, offering a practical template.
02:410.5 Level as Price Magnet
Highlights a key concept in ICT trading that helps identify potential reversal points.
04:12W Formation Confirmation
Demonstrates a specific chart pattern that signals a potential trend reversal.
05:33Risk-Reward Ratio 1:4
Shows the importance of favorable risk-reward ratios in trade selection.
09:49[00:02] I'll explain what kill zones are, why they're important, how to use them in trading, and why they're especially important if you're day trading. Killzones are trading session that experience the most market activity. It is during
[00:17] these periods that key manipulations occur and the main movement of the daily candle unfolds. There are only four killzones: Asian, London, New York and London closure. These are the periods when the best
[00:32] opportunities to enter a trade with optimal timing to achieve goals are formed. The Asian killzone starts with the opening of the day at 3:00 am and lasts until 8:00 am. It is usually accompanied by a range, or, as often happens in the cryptocurrency
[00:46] market, the formation of a daily extreme. Haya or luya. London Kilzone. Active from 9:00 am until lunch. At this time, one can expect the formation of the daily extreme if Asia has consolidated. A corrective movement into
[01:01] the premium market in a bearish market or into the discout market in a bullish market is also possible. This usually happens when a high or low forms in Asia. In some cases, during the London killzone, price may consolidate. This is especially often
[01:15] observed in the crypto market. In this case, we do not trade and wait for case, we do not trade and wait for New York to open. This is the period from 14:00 to 17:00. At this time, we most often observe a correction in the premium or discount market and a
[01:28] continuation of the current trend. Less often, high or low is formed. This usually happens if the London Akizone was in consolidation. A sideways movement during this period is extremely rare and most often occurs when a
[01:43] strong impulse occurs in London, which reaches a significant problem area. London's lockdown begins immediately after the New York killzone ends. This is the period from 17:00 to 19:00. The price of education at this time depends entirely on the previous
[01:58] sessions. Most often, a correction of the opposite daily trend begins, which can be described as a movement into the premium or dio market. The formation of a high or low for the current day may also occur. Sometimes it is during this period that the
[02:12] daily trend reaches its extreme, after which a pullback begins, which continues until the opening of the next day. If . Please note that all times shown are in
[02:27] UTC+3. If you are in a different time zone, you need to adjust it to your local time. A typical shopping profile is shown below. During the Asian kill zone, the market consolidates, so we do not open any positions. The
[02:41] lower boundary of the range is being updated in London . The minimum of the day is formed, after which growth begins. The opening of the New York killzone begins with a correction in the discudutmarket. This is the best opportunity for a long position, because then the
[02:56] main growth planned for the current day will start. At the close of London, the price corrects downwards. It was possible to consider short-term counter-trend trades on it. Now we will analyze each kill zone on real
[03:08] charts without reference to ideal schemes. But first, I recommend subscribing to my Telegram channel. There is much more activity in it. I share my thoughts, expectations for the market, and show how everything I talk about here
[03:20] works in real time even before it is implemented. Link in the description. Our task now is to analyze each kill zone separately and understand which typical scenarios most often form during these periods. They can be used on a
[03:34] daily basis. I will show all examples on cryptocurrency pairs. Let's start with the Asian Kilzona. It opens at 3:00 am and closes at 8:00 am. If the price consolidates during this period,
[03:47] we do not consider opening positions. Every new day we assume that the extreme of the day will form within the Asian akilzone . minimum or maximum. In the current context, given the prevailing growth, it is appropriate to expect
[04:00] the formation of the daily minimum. I marked the trading range from Lui, from which the upward impulse started, to Duhai, where the correction began. This allows us to assess its potential depth. The price is expected to
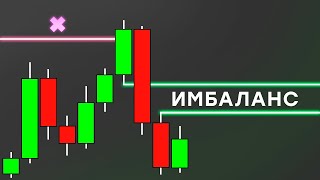
[04:12] move towards the 0.5 level because it reflects the fair value of the asset and acts as a price magnet. Below is a bullish imbalance. This is a support zone, the rebalancing of which is highly likely to lead to a
[04:26] price reaction and continued growth. Therefore, here we are looking at the possibilities of opening a long position during the Asian kill zone. You can enter from the beginning of the imbalance. Stop-loss is placed behind the first candle of its formation, and take-profits
[04:39] are distributed between the maximum of the Asian gil zone and the maximum of the previous day. These are the priority goals for each trading day.
[04:52] upward impulse movement. The lung position was successfully closed inside our kill zone, although this is not a mandatory condition. The main testing may take place later, in London or New York. This is quite normal.
[05:05] The main thing I want to show is that the Asian kill zone formed a low for the current day, after which the upward trend continued. This development of events provides an easy opportunity to open a trade at the low of the
[05:17] day at the very beginning. Next example. And now we’ll look at the London killzone, but first the context. The price is traded in range. Here is its upper border, and here is the lower one, which has already been removed. This resulted in the formation of the
[05:33] W formation, which consists of three elements: Llow, Lowerkhaya and another Lower Low. Confirmation occurs here because the key structural high is updated . Although the price failed to consolidate above the lower level, this is not
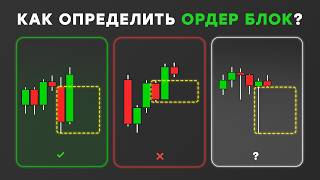
[05:47] critical, since the previously formed bullish imbalance and order block signal the emergence of an upward lower flow and are more significant than the fact that the price did not consolidate above the key level. As a result, the Urderblock was
[06:02] tested and from this swing the upward movement began. The upper limit of the range is our key target. This is the closest pullback to buying liquidity, which is further reinforced by the inefficiency above. This creates a
[06:15] powerful pull on price. Taking this into account, we can form a plan for the day. From the opening of the new day, and hence the Asian kill zone, it was quite natural to expect a correction in the currency pair so that the daily low would form and
[06:29] growth would begin. But this did not happen. The price opened, dropped a little and immediately began to rise. On the left we see a dense accumulation of liquidity, so it is dense accumulation of liquidity, so it is
[06:42] Since there was no significant movement, it can be considered that Asia was in consolidation. New semi-liquidity has emerged on both sides , which will most likely be exploited by smart capital in the next kill zones. What is
[06:56] our plan for opening the London Kilzone? The first option is to wait for a correction to our order block and open a long position with the aim of reaching the upper boundary of the range. The second is the renewal of the upper boundary of the range with a subsequent decline to the crossover
[07:11] block, which will act as the first problem area on the path of the first problem area on the path of the downward movement. Let me clarify right away that we can only implement one scenario. As soon as the first one starts, the
[07:23] second one is automatically cancelled and vice versa. With the opening of London, the upper boundary of the range is updated and the bearish inefficiency is partially filled. This candlestick close is the first bearish
[07:36] signal because its shadow forms an upper block on the lower timeframe, which we will use to find the entry point for a short position. The is used as a basis for finding intraday trades. This is what
[07:50] our urderblock looks like. It is absorbed by the next candle, and already at 10:30 we limit order is placed at the beginning of an order block. Stop-loss is set behind
[08:02] its high. This is the level at which, if broken, the block becomes irrelevant. And take profit is placed at the minimum of the Asian kill zone and the border of the support zone located below. The risk-reward ratio is 1:
[08:15] t, which confirms the high efficiency of entry. , from which one can also consider entering a trade,
[08:27] especially if the first opportunity was missed. And here is the complete processing and closing of the transaction within the current day. Also pay attention to the complete filling of the previously indicated imbalance. After this, the decline continued.
[08:41] As a result, the London Kilzone formed a high for the day after the formed a high for the day after the Asian Kilzone's extreme was updated. Opportunities like these are a simple and common pattern that you can
[08:53] use on a daily basis. In the following example, the low of the day is formed in the Asian zone. This means that in London we will expect a that in London we will expect a correction in the discout market to the OTE zone.
[09:06] The trading range is defined from this to the current high. The key support zone is the breaker block. It is determined from the swing extreme to the minimum of this candle. Below it is the Urderblock, as well as several zones of
[09:20] Urderblock, as well as several zones of inefficiency. One, two and three. several levels at once from which we can expect a price reaction during the upcoming correction. This is enough to consider opening a long position.
[09:34] Entry point for testing breakerblock. An aggressive stop loss is placed below it. We place the IQI at the nearest maximum from which the correction began, and at the FTA level slightly higher. The risk to reward ratio is almost 1 to
[09:49] 4. Great deal. A more conservative approach is to place 100+ sub-books. This reduces it almost in half, but at a distance it gives higher HP. The choice here depends on your trading style. Let's look at the work.
[10:05] The deal was completed entirely within the London kill zone. This is a great example of what to do when the low of the day is formed in Asia. This is the first part of the video about killzones. are ending. As you can see, by understanding standard
[10:20] price development scenarios at a given time and correctly reading the context, you can create clear trading plans for each day and systematically extract profits from the market. It is especially important to understand how different sessions are related to each other and how their
[10:34] logic shapes price behavior throughout the day. In the next video, we'll continue with a detailed look at the New York City opening and London closing killzones. These are the key periods with the most powerful moves, and understanding their structure will
[10:48] give you even more accurate and predictable trade entry opportunities . If you found this video helpful, please give it a like, comment on which SkillZone you use most often, and subscribe to
[11:00] my Telegram channel. That's where the main activity is. Good luck. M.
⚡ Saved you 0h 11m reading this? Transcribe any YouTube video for free — no signup needed.