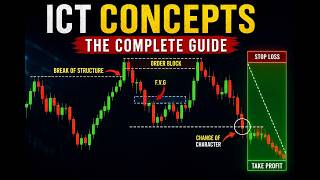

ICT Concepts Simplified in 20 Minutes
45sAddresses a common pain point (feeling overwhelmed) and promises a simple, comprehensive explanation, which is highly engaging for beginners.
▶ Play Clip"Title promises a complete guide to ICT concepts and delivers exactly that with clear explanations and examples."
This video simplifies ICT (Inner Circle Trader) trading concepts, including liquidity sweeps, market structure, fair value gaps, and order blocks. It explains how institutions use liquidity to enter/exit positions and provides real chart examples to demonstrate how to apply these concepts in trading.
Market trades above an old high to trigger buy stop orders and attract breakout traders before reversing lower.
Market trades below old lows to trigger stop losses of buyers and trap sellers before reversing higher.
Occurs below support in a range; market sweeps liquidity below the range low then reverses higher.
Occurs above resistance in a range; market sweeps liquidity above the range high then reverses lower.
Liquidity sweeps within a trend during pullbacks, signaling trend continuation.
New swing high in uptrend or new swing low in downtrend confirms trend continuation.
First break of a previous swing low in uptrend (or high in downtrend) signals potential reversal.
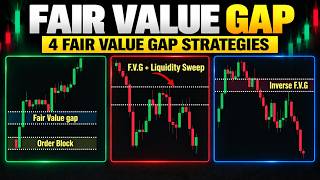
Inefficiency from rapid price movement; price often returns to rebalance.
Last candle before impulsive move creating FVG; areas where institutions placed large orders.
ICT concepts help traders understand institutional order flow and identify high-probability setups by combining liquidity sweeps, market structure, fair value gaps, and order blocks with proper confirmation.
What is a buy side liquidity sweep?
When the market trades above an old high to trigger buy stop orders and attract breakout traders before reversing lower.
01:11
What is a sell side liquidity sweep?
When the market trades below old lows to trigger stop losses of buyers and trap sellers before reversing higher.
02:29
What is a bullish external liquidity sweep?
Occurs below support in a range; market sweeps liquidity below the range low then reverses higher.
04:08
What is a bearish external liquidity sweep?
Occurs above resistance in a range; market sweeps liquidity above the range high then reverses lower.
05:56
What is a bullish internal liquidity sweep?
In an uptrend, price breaks below a pullback low, triggering stop losses and trapping sellers, then continues higher.
07:41
What is a break of structure (BOS)?
When the market creates a new swing high in an uptrend or a new swing low in a downtrend, confirming trend continuation.
10:16
What is a change of character (CHoCH)?
The first break of a previous swing low in an uptrend (bearish CHoCH) or break of a previous swing high in a downtrend (bullish CHoCH), signaling potential reversal.
10:55
What is a fair value gap (FVG)?
An area where price moved so quickly that it left an imbalance between buyers and sellers, often revisited to rebalance.
12:37
How is a golden fair value gap identified?
When the FVG aligns with the 50% or 61.8% Fibonacci retracement level of the impulsive move.
15:11
What is an order block?
The last candle before the impulsive move that created a fair value gap; represents areas where institutions placed large orders.
16:34
Buy Side Liquidity Sweep Definition
Core concept explaining how institutions use stop losses and breakout orders above highs.
01:11Change of Character Signals Trend Shift
Key principle for identifying potential reversals before they happen.
10:55Fair Value Gap as Imbalance
Explains why price often returns to these areas, providing trading opportunities.
12:37Order Block as Institutional Zone
Refines supply/demand zones to pinpoint where institutions likely entered.
16:34[00:00] Have you ever tried learning ICT and felt completely overwhelmed by all the concepts? Liquidity, fair value gaps, order blocks, breaks of structure. It can feel like learning a new language. Well, in this video, I'm going to simplify everything for you.
[00:14] By the end of this video, you'll understand every major ICT concept. And more importantly, you'll know exactly how to use them in your own trading. In this video, you'll learn buy-side and sell-side liquidity sweeps.
[00:27] bullish and bearish external liquidity sweeps, bullish and bearish internal liquidity sweeps, break of structure, change of character, fair value gaps, order blocks.
[00:39] And to make everything crystal clear, I'll walk you through real chart examples and show you exactly how to apply each concept successfully in your own trading. Before we get started, if you enjoy this type of content
[00:51] and want to see more trading videos like this, make sure to hit the like button, subscribe to the channel, and turn on the notification bell so you never miss a new video. With that out of the way, let's get started. Let's start with the first ICT concept, Buy Side Liquidity Sweep.
[01:07] A Buy Side Liquidity Sweep happens when the market trades above an old high to trigger buy stop orders and attract breakout traders into the market before reversing lower. Remember, many traders who are short place their stop losses above resistance or above previous highs.
[01:23] At the same time, breakout traders often buy when they see price breaking above those highs. As a result, a large pool of buy orders builds up above the highs. Institutions can use this liquidity to enter or exit positions,
[01:37] which is why the market often runs above a high first and then reverses. Now let's look at an example. This is the British pound versus the US dollar on the daily chart. The market was moving higher until it reached this level and reversed,
[01:51] creating a resistance level. A few days later, price retraced back to that resistance, traded above the old high, and
[02:03] then closed back below it. This is a classic buy side liquidity sweep. The market first took the liquidity resting above the high, triggering stop losses and breakout buyers, and then reversed sharply to the downside.
[02:16] As you can see, what looked like a bullish breakout was actually the market collecting liquidity before making its real move lower. Now let's talk about sell-side liquidity, or SSL. Sell-side liquidity is simply a pool of sell-stop orders that sits below old lows in the market.
[02:32] These lows become important because that's where many traders place their stop losses. When traders buy the market, they usually protect their positions by placing their stop losses below support or below the previous low.
[02:44] As more and more traders do this, a large pool of liquidity begins to build underneath those lows. Institutions know where this liquidity is resting. As a result, the market will often trade below these lows, trigger those stop losses, and
[02:58] make it look like the downtrend is about to continue. But many times, that move is simply the market collecting liquidity before reversing higher. This is called a sell-side liquidity sweep. Now let's look at an example. The market was trending down until it reached this level and reversed, creating a support
[03:14] level. Look at what happened next. The market retraced back toward that support, broke below it, and then closed back above
[03:30] it. This is a classic sell side liquidity sweep. The market first took the liquidity resting below the support level, and then quickly reversed. Now look at what happened next.
[03:52] After sweeping the sell-side liquidity, the market rallied strongly to the upside. What looked like a bearish breakdown was actually the market collecting liquidity before making its real move higher.
[04:04] A bullish external liquidity sweep occurs below the support level of a range-bound market. When the market is trading sideways, many traders buy near support because they expect the support level to hold. To protect their positions, they usually place their stop losses just below the range low.
[04:19] As more traders do this, a large pool of sell-side liquidity begins to build underneath the support level. The market will often trade below the support, triggering those stop losses and convincing traders that the range is breaking to the downside.
[04:33] However, instead of continuing lower, price quickly reverses back into the range and starts moving higher. This is called a bullish external liquidity sweep because the market sweeps liquidity below the range before making a bullish move.
[04:46] Now let's look at an example. As you can see, the market was initially trending higher. It then reached this level and reversed, forming a resistance level. Later price declined found support at this level and reversed higher At this point the market is trading inside a range with a clearly defined resistance and support level Now pay close attention to what happened next
[05:09] The market broke below the support level, taking the liquidity resting underneath the range low and then quickly reversed and closed back above the support. This is a clear bullish external liquidity sweep.
[05:21] Look at what happened next. After sweeping the liquidity below the range, the market rallied strongly and moved all the way back to the resistance level.
[05:34] This example perfectly illustrates an important principle of liquidity. Markets often sweep liquidity at one side of the range before moving toward the liquidity resting on the opposite side of the range. A bearish external liquidity sweep occurs above the resistance level of a range-bound market.
[05:50] As the market trades sideways, many traders sell near resistance because they expect the level to hold. To protect their positions, they usually place their stop losses just above the range high.
[06:02] At the same time, breakout traders place buy orders above the resistance, expecting the market to break out and continue higher. As a result, a large pool of buy side liquidity builds above the range high.
[06:15] The market will often trade above the resistance level, triggering those stop losses and breakout orders. However, instead of continuing higher, price quickly reverses back into the range and starts moving lower.
[06:27] This is called a bearish external liquidity sweep because the market sweeps liquidity above the range before making a bearish move. Now let's look at an example. As you can see, the market was initially trending higher.
[06:39] It then reached this level and reversed, forming a resistance level. Later, price declined to this level and reversed again, creating a support level. At this point, the market is trading inside a range with a clearly defined resistance and support level.
[06:55] Now look at what happened next. As price returned to the resistance level, it broke above it and then quickly closed back below it, forming what we call a bearish external liquidity sweep.
[07:08] The market first took the liquidity resting above the range high and then reversed sharply lower. Look at what happened next. After sweeping the liquidity above the resistance level, the market sold off and moved all the way down to the support level.
[07:21] This example highlights another important principle of liquidity. Markets often sweep liquidity on one side of a range before moving toward the liquidity resting on the opposite side of the range. So far, we've looked at external liquidity,
[07:35] which occurs at the boundaries of a range. But liquidity can also form during a trending market, and this is known as internal liquidity. Internal liquidity refers to liquidity sweeps that occur inside a trend.
[07:47] These sweeps usually happen during pullbacks and often signal that the trend is ready to continue. In an uptrend, the market doesn't move higher in a straight line. It rallies, pulls back, and then continues higher.
[07:59] During these pullbacks, some traders begin to believe that the trend is reversing. They enter short positions or close their long positions too early. As a result, liquidity starts to build below the pullback lows.
[08:11] The market will often break below these lows, trigger the stop losses of buyers and trap sellers into short positions, before quickly reversing back to the upside. This is called a bullish internal liquidity sweep, because the sweep occurs within an uptrend and leads to a continuation of the bullish move.
[08:28] Now let's look at an example. As you can see, the market is clearly trending higher. It breaks above this resistance level and continues to the upside. Now pay close attention to what happens next.
[08:40] The market pulls back toward the old resistance level, which is now acting as support. Price then breaks below that support level but quickly closes back above it, forming a bullish internal liquidity sweep.
[08:52] This move indicates that sellers got trapped during the pullback and that buyers have regained control of the market. Look at what happened next. After sweeping the liquidity below the pullback low, the market resumed its uptrend and continued
[09:08] moving higher. Now let's look at a bearish internal liquidity sweep. As you can see, the market is clearly trending lower. It breaks below this support level and continues moving down, confirming the downtrend.
[09:20] Now pay close attention to what happens next. The market pulls back toward the old support level, which is now acting as resistance. At first glance, it looks like the market may be reversing to the upside.
[09:34] However, price breaks above the resistance level and then quickly closes back below it, a bearish internal liquidity sweep. This move indicates that buyers got trapped during the pullback, while sellers regained control of the market. In other words, the market used
[09:49] the liquidity resting above the pullback high to fuel the next leg lower. Now look at what happened next.
[10:01] After sweeping the liquidity above the resistance level the market resumed its downtrend and continued moving lower. Now let's move on to another important ICT concept, the break of structure, or BOSS.
[10:13] A break of structure occurs when the market creates a new swing that is in the direction of the current trend. For example, in an uptrend, the market is making a series of higher highs and higher lows.
[10:25] As long as the market keeps creating new higher highs, the uptrend remains intact. Every time price breaks above a previous swing high and creates a new higher high, we have a bullish break of structure. On the other hand, in a downtrend, the market creates lower lows and lower highs.
[10:42] Every time price breaks below a previous swing low and creates a new lower low, we have a bearish break of structure. Simply put, a break of structure tells us that the current trend is still healthy and
[10:54] likely to continue. A change of character is the first sign that the current trend may be coming to an end. For example, if the market is in an uptrend, it keeps making higher highs and higher lows. But eventually, something changes. Instead of making another higher low, the market breaks
[11:11] below the previous swing low for the first time. This is called a bearish change of character. It tells us that sellers are starting to gain control and that the market may be preparing for a reversal. Likewise, during a downtrend, the market keeps making lower lows and lower highs.
[11:28] If price suddenly breaks above a previous swing high for the first time, we have a bullish change of character. This indicates that buyers may be taking control of the market. Look at this chart example. As you can see, the market is trending higher. First, we have this bullish break of
[11:44] structure, then another bullish break of structure, and finally a third bullish break of structure. At this point, the market is clearly in an uptrend. However, something changes here. For the first time, price breaks below a previous swing low, forming a bearish change of character.
[12:00] Now, this does not automatically mean that the trend has reversed. The market could simply be taking liquidity before continuing higher. To confirm that the market has truly shifted from an uptrend to a downtrend, we need to see another bearish break of structure.
[12:13] In other words, we need price to break below this swing low and create a new lower low. Look at what happened next. The market broke below the low, giving us a bearish break of structure and confirming the change of character.
[12:29] At this point, we have confirmation that the market is likely transitioning from an uptrend to a downtrend. Now let's talk about one of the most important concepts in ICT trading, the fair value gap, or SVG.
[12:42] A fair value gap forms when the market moves aggressively in one direction. Sometimes, price moves so quickly that it doesn't spend enough time trading at every price level. Instead of moving in a balanced way, the market leaves behind an imbalance between buyers and sellers.
[12:58] This imbalance creates a gap between three candles. For a bullish fair value gap, the low of the third candle is above the high of the first candle. For a bearish fair value gap, the high of the third candle is below the low of the first candle.
[13:11] But why does this matter? A fair value gap represents an area where the market moved too efficiently in one direction and didn't spend enough time facilitating trade. You can think of it as an unfinished area on the chart.
[13:24] Because of this, price often returns to these imbalances later to rebalance the market before continuing its move. This doesn't mean that every fair value gap will hold, and it certainly doesn't mean that you should blindly buy or sell every time price reaches one.
[13:38] Instead, a fair value gap simply tells us The market moved too fast here, and there is a good chance that price may revisit this area in the future. When price returns to a fair value gap, traders watch closely to see how the market reacts.
[13:53] Will buyers step back in? Will sellers regain control? The answer to those questions often provides high probability trading opportunities, especially when the fair value gap aligns with other concepts such as liquidity and market structure.
[14:06] Now let's put everything together and see how we can actually trade a fair value gap. The first thing we want to identify is the market structure. In this example, the market was initially creating higher highs and higher lows, showing a bullish trend.
[14:20] But then, something changed. Price made an aggressive move to the downside and broke below the previous swing low. That break tells us something important. The market has shifted from bullish to bearish, and sellers are now in control.
[14:34] Next, focus on the move that caused the break of structure. Notice how price moved sharply lower. During this impulsive move, the market didn't trade efficiently, leaving behind an imbalance. That imbalance created a fair value gap.
[14:48] You can clearly see the three candle formation where the first and third candles do not overlap, leaving an area of inefficient pricing. This fair value gap becomes our area of interest Now we add another layer of confluence by using Fibonacci We not using Fibonacci to predict where price will go Instead we using it to measure the strength of the impulsive move
[15:09] To do this, we draw the Fibonacci retracement from the beginning of the bearish move to its lowest point. Then we ask one simple question. Does the fair value gap align with the 50% or the 61.8% retracement level?
[15:24] If it does, we refer to it as a golden fair value gap. As you can see, in this example, the fair value gap aligns perfectly with the 61.8% Fibonacci level, giving us additional confluence.
[15:37] Now look at what happens next. price retraces back into the fair value gap and begins to rebalance the inefficiency that was
[15:56] left behind during the impulsive move after testing the zone sellers step back into the market and price continues lower this is exactly the type of setup we're looking for however there is one important thing to remember. Even if a fair value gap forms after a break of structure and
[16:13] aligns with the 50% or the 61.8% Fibonacci level, that still does not mean we should enter immediately. Instead, we wait for price to retrace into the fair value gap and then observe how the market
[16:26] reacts. That reaction is what provides confirmation and separates a high probability setup from an average one. Now that you understand liquidity, market structure, and fair value gaps, let's move on to another important ICT concept, order blocks. An order block is a refined version of a supply or
[16:43] demand zone. The difference is that an order block attempts to identify areas where large institutional participants entered the market. When institutions place large orders, they create a strong imbalance between buyers and sellers, causing price to move aggressively in one direction.
[17:00] This imbalance is often visible through a fair value gap or FED. A fair value gap forms when price moves so quickly that some price levels are barely traded, leaving behind an inefficiency or imbalance in the market. The market frequently revisits these imbalances later to rebalance price.
[17:17] In practice, we identify an order block by marking the last candle before the impulsive move that created the imbalance. This candle becomes our order block zone because it likely represents the area where institutions made their trading decisions. If price returns to that level in the
[17:33] future, it often reacts sharply because large market participants may still have unfilled orders there or may be interested in defending that area. Now let's put everything together and see how to trade an order block in real market conditions. In this example, the market
[17:49] is clearly trending higher, creating a series of higher highs and higher lows. Next we identify a bullish order block. This zone is important because it represents the last bearish candle before an aggressive move to the upside that created a fair value gap.
[18:04] Since the imbalance originated from this candle, we mark it as our order block zone. Now we wait patiently. Eventually the market pulls back into the order block, but we don't enter immediately.
[18:18] Instead, we want to see evidence that buyers are still defending the zone. Look at what happens next. As price trades into the order block, it forms a pin bar candlestick, rejecting lower prices and closing back to the upside.
[18:32] This rejection tells us that buyers have stepped back into the market and that the uptrend may be ready to resume. However, before entering the trade, we need to make sure that the higher time frame agrees with our idea.
[18:44] Since this setup is forming on the one-hour chart, our higher time frame will be the daily chart. When we switch to the daily time frame, we can clearly see that the market structure is bullish, with price continuing to make higher highs and higher lows.
[18:57] This gives us additional confidence because our lower timeframe setup is aligned with the higher timeframe trend. With the higher timeframe confirming our bullish bias, we return to the one-hour chart and plan our trade.
[19:10] Entry. At the close of the pin bar. Stop loss. Below the low of the order block. Target. A minimum reward-to-risk ratio of 2 to 1. At this point, there is nothing left to do except let the market play out.
[19:27] As you can see, price reacts strongly from the order block, buyers take control, and the market rallies higher, eventually reaching our profit target and delivering an excellent reward to risk ratio.
[19:39] And that's it for this complete guide to ICT concepts. I hope this video helped simplify these ideas and showed you how to actually apply them in your trading. If you found value in this video, don't forget to hit the like button, subscribe to the channel,
[19:54] and turn on the notification bell so you don't miss future trading content. Thanks for watching, and I'll see you in the next video.
⚡ Saved you 0h 20m reading this? Transcribe any YouTube video for free — no signup needed.