
What is Liquidity in Trading?
45sExplains the core concept of liquidity in a simple, relatable way, making viewers curious about how big players manipulate prices.
▶ Play Clip"The title accurately promises a liquidity trading strategy using smart money concepts, and the video delivers exactly that with clear examples and a rule-based approach."
This video explains the concept of liquidity from a Smart Money trading perspective, showing how to identify liquidity zones, distinguish them from major supply and demand levels, and apply a rule-based liquidity trading strategy with specific entry and exit points.
Liquidity means money; every trade is a transaction between buyers and sellers. More money in the market makes it easier for big players to trade without causing price spikes.
Large entities need sellers in the market to exchange huge sums without dramatically moving the price. They seek liquidity zones where retail traders have placed orders.
Liquidity is where retail traders get involved. For example, below a demand zone, stop losses of buyers create a liquidity pool that institutions can grab.
When price reaches a trend line, traders go long and place stop losses below the line. That area becomes a liquidity zone. Grabbing it can fuel a trend continuation.
Liquidity zones before demand/supply areas create perfect trading opportunities. They help distinguish high-probability zones from less reliable ones, improving entries and reducing losses.
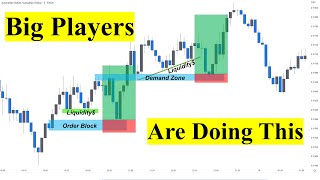
Price breaking structure with inefficiency leaves an order block. If price returns to fill the gap, it's an excellent entry. Grabbing liquidity before reaching an order block makes it a perfect opportunity.
Grabbing liquidity before an order block is not a law; price can break through the order block and reverse. Always look for a reversal pattern on lower time frames before trading.
Trend lines, consolidation areas, moving averages, but mainly equal highs and lows. Keeping it simple helps apply the concept effectively.
The strategy works on any timeframe and market (Forex, crypto, stocks). Two steps: identify trend using EMA 50, then look for a liquidity sweep pattern.
Wait for price to make a support and either wick below or close below and get back above. Enter after the candle or on confirmation. Stop below the wick, target next structure level.
Always check higher timeframe to see room to next structure level. For bearish, similar logic applies with EMA 50 break to downside and liquidity grab above resistance.
Identifying liquidity zones and using a simple EMA 50 trend filter with liquidity sweeps can significantly improve trade entries and risk-to-reward ratios. Always consider higher timeframe context and confirm with lower timeframe reversal patterns.
What is liquidity in trading?
Liquidity means money; it represents the volume of buyers and sellers in the market.
00:59
Why do big players need liquidity?
To exchange large sums without dramatically moving the price; they need sellers to buy cheap.
01:14
Where are liquidity zones typically located?
Below demand zones (where stop losses of buyers are) and above supply zones (where stop losses of sellers are).
01:43
What is the benefit of identifying liquidity zones?
They act as fuel for price movements, help distinguish high-probability zones, and improve entries with fewer losses.
02:51
What is the caveat when price grabs liquidity before an order block?
It is not a law; price can break through the order block and lead to a major trend change.
04:02
What are the two main steps of the liquidity trading strategy?
1. Identify trend using EMA 50 (price breaks EMA and makes three moves breaking structure). 2. Look for a liquidity sweep pattern.
05:44
How do you enter a trade after a liquidity sweep?
Enter right after the sweep candle or wait for a confirmation candle closing higher than the previous candle.
06:39
Where should the stop loss be placed in this strategy?
Below the long wick of the sweep candle.
06:55
What is the target for the trade?
The next level of structure.
06:55
Why is higher timeframe analysis important?
To see how much room price has to reach the next structure level and to confirm the trend.
07:09
Liquidity Defined
Fundamental concept that underpins the entire strategy.
00:59Liquidity Zones Location
Key insight that retail traders' stop losses create liquidity pools.
01:43Benefits of Identifying Liquidity Zones
Explains why this concept improves trading performance.
02:51Important Caveat
Reminds traders that no setup is guaranteed; risk management is essential.
04:02Liquidity Trading Strategy Overview
Provides a clear, rule-based framework for execution.
05:44[00:02] smart risk understanding the liquidity concept will instantly improve your entries and exits help you to run into a lot fewer losses and allow you to catch insane risk to reward ratio trades in this video we will explain the
[00:17] powerful concept of liquidity from Smart money trading perspective we will show you which moves are liquidity grab and how to apply this concept on the chart and finally our key and rule-based
[00:30] liquidity trading strategy with specific entry and exit points so guys if that's something you are interested in click on the like And subscribe buttons to show your support and I will see you after the intro
[00:44] and I will see you after the intro [Music]
[00:59] so what is liquidity liquidity basically means money every trade is a transaction between the buyers and sellers so more money in the market makes it easier to trade for big players
[01:14] suppose a huge company needs to exchange hundreds of millions of dollars into euros and if they do this when liquidity is low the price will Skyrocket they don't want to increase the price because they simply want to buy cheap
[01:29] so they need liquidity or in other words they need sellers in the market so the question is where are the liquidity zones liquidity is where retail Traders get involved in the market
[01:43] we know that if price makes it to this demand Zone Traders will get involved with buying pressure and it is not just retail Traders institutions Etc
[01:56] so if they Place buying orders here their stop losses are cells hence the liquidity zone is below this demand Zone and the condition is ready for the company to grab the liquidity and then the price makes a sharp move to
[02:10] the upside here on the top when the price reaches this trend line at access support so Traders will go long when price touches the trend line and place their stop losses below the line
[02:23] so this is our liquidity Zone and below that we have a major level of structure that has recently acted as both support and resistance multiple times level in that case it will give us a perfect
[02:38] trading opportunity to go long because grabbing the liquidity will provide the conditions for continuing the price trend which is precisely what we would like to see what are the benefits of identifying
[02:51] liquidity zones on the chart first an existing liquidity Zone before a demand or Supply area makes them A Perfect Trading opportunity because liquidity acts as fuel for the movements we want to see in the market
[03:06] the second benefit of identifying liquidity zones is that you can distinguish liquidity areas with a less chance of working from major demand and Supply Zone this helps you promote your entries and
[03:18] run into fewer losses in your trades here price broke through the structure level with inefficiency leaving behind a perfect order block so if the price gets back to this area to fill the Gap it would be an excellent
[03:33] opportunity to place by orders after this sharp move the trend got exhausted and see how many times it created liquidity zones after that the price broke the support levels it took out early buyers grabbed
[03:48] all the liquidity and continued moving to the upside so here is an important Point grabbing the liquidity before reaching an order block makes it a perfect trading opportunity but it is not a law
[04:02] because price can easily break through the order block and lead to a major Trend change so that is why we always look for a reversal pattern on Lower look for a reversal pattern on Lower time frames before placing the trades
[04:19] there are many liquidity zones like trend lines consolidation areas even major moving averages Etc but we mainly pay attention to equal highs and lows we want to keep things as simple as
[04:31] possible and be able to use this concept for our benefit so look at this example this is how we distinguish major supply and demand levels from liquidity areas starting from the left we had a nice
[04:46] starting from the left we had a nice move to the upside with inefficiency we would have been waiting for the price to come down and fill this Gap in place orders in the order block Zone here we had an opposite color candle
[04:59] that created inefficiency which would have been a perfect demand level for at the top we had a major level of structure that recently acted as both support and resistance multiple times again A Perfect Trading opportunity for
[05:15] again A Perfect Trading opportunity for buyers liquidity let's jump into our key liquidity trading strategy but before we do that if you have enjoyed the video so far please give it
[05:29] a thumbs up and subscribe to our Channel since it goes a long way to support us in making more videos like this trading setup is not limited to any time frames and could be traded in Forex crypto and stock markets
[05:44] it is really simple and it consists of two major steps first we identify the trend using an exponential moving average to do that we apply EMA 50 on the chart and simply need the price to break the
[05:59] EMA in One Direction and give us one two three moves with the third move breaking the structure level for example here the price broke the 50 EMA to the upside made one two and three moves and broke the previous Market
[06:13] structure so we have identified that our trend is bullish as long as we stay above the higher low and we will only look for buying opportunities in the second step we look for a
[06:26] liquidity sweep pattern it means that we wait for the price to make a support and either Wick below the support and grab the liquidity or close support and grab the liquidity or close below the support and get back above
[06:39] here see how the market made support and grab the liquidity with this longwick so you can either enter right after this candle or wait for confirmation candle closing higher than the previous candle our stop will be below the long Wick
[06:55] Candlestick and we will Target the next level of structure you could also make your trade break even by closing half of your position target here is the key point
[07:09] always look at the higher time frame to see where the price is and how much room it has to reach the next level of structure for example this is the same chart right before placing the trade if we zoom out
[07:22] to one hour's time frame we can see that the price has recently broken the structure to the upside and it has a lot of space to go until it reaches the next level of structure also if it breaks the higher low to the
[07:35] downside we will look for shorting opportunities in the lower time frame until it reaches the next level of Market structure discussed applies to the bearish scenario
[07:48] so let's see a bearish example here on the euro dollar 15 minutes we can see that market broke the EMA 50 to the downside with one two and three moves so we have a bearish bias after that market made a resistance and
[08:03] broke it to the above grab the liquidity and immediately got back to the range Breakout so this is when we execute our trade
[08:16] as I said this strategy is not limited to any time frame or session but do your works best so guys I hope this video has been
[08:28] useful to you if it has please click the like And subscribe buttons to help us continue producing more videos like this also comment below with your thoughts and questions since we always do our best to answer them all
[08:43] best to answer them all you in the next episode
⚡ Saved you 0h 08m reading this? Transcribe any YouTube video for free — no signup needed.