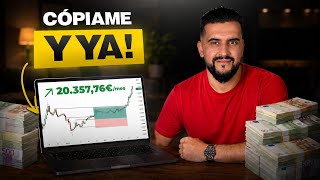

I Made $8,000 in 2 Hours Trading
45sThe promise of quick, high earnings immediately grabs attention and sparks curiosity.
▶ Play Clip"Delivers a real strategy with a concrete trade breakdown, but the title oversells the 'boring' aspect and the income claim lacks full proof."
Benjamin, a trader with over 7 years of experience, shares his 'boring' yet profitable trading strategy that has earned him over $380,000 in payouts from funding companies. He analyzes a specific trade that made over $8,000 in a couple of hours, emphasizing the importance of trading during high-volatility sessions (London and New York) and using H4 and H1 timeframes to identify liquidity points. The strategy focuses on entering trades when the price reacts at these key levels, using confirmations like imbalances on lower timeframes.
Benjamin introduces himself, claiming over 7 years of trading experience and a strategy that has earned over $380,000 in payouts from funding companies. He promises to analyze a trade that made over $8,000 in a couple of hours.
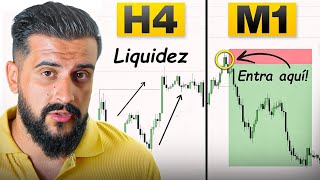
The strategy uses H4 and H1 timeframes to analyze the market and determine key points of interest where the price is expected to react. These are the primary timeframes for identifying liquidity zones.
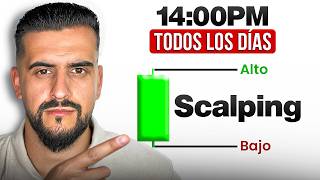
High volatility occurs during London (9-11 AM Spain time) and New York (2-4:30 PM Spain time) sessions due to high volume of bank transactions. Trading during these times increases the probability of clear directional moves.
Liquidity is located at market highs and lows, where pending orders (stop losses, take profits, limits) accumulate. The price tends to react at these points because of the volume of transactions, often moving opposite to the majority's expectation.
Two examples: when price breaks a high, it often reacts downwards (selling scenario); when it breaks a low, it often reacts upwards (buying scenario). This is due to the liquidity at these levels.
After price reaches a liquidity point, move to a lower timeframe (1-5 minutes) to look for precise confirmations, such as imbalances (voids) in a three-candle sequence, to enter with a better risk-reward ratio.
On May 1st, during the New York session, the price broke a 4-hour high, creating a selling opportunity. He waited for high-impact news at 3:45-4 PM, then entered on a one-minute timeframe after an imbalance formed, targeting a 1:2 risk-reward ratio.
The trade reached a 1:5.62 risk-reward ratio, earning over $8,000 in a couple of hours. He emphasizes that his students also took the same trade via signals.
The strategy is simple: trade during high-volatility sessions, identify liquidity points on H4/H1, and enter on lower timeframes with confirmations like imbalances. This approach has been consistently profitable for Benjamin, and he encourages viewers to backtest it.
What are the two most important trading sessions mentioned?
London session (9-11 AM Spain time) and New York session (2-4:30 PM Spain time).
02:28
Where is liquidity located in the market?
At every maximum and minimum price, especially on higher timeframes like H4 and H1.
04:31
What is an imbalance (void) in trading?
A three-candle sequence where the first and third candles do not touch, indicating a strong move.
12:44
Why does the price tend to react at liquidity points?
Because there are many pending orders (stop losses, take profits, limits) and banking transactions, creating a high volume of money.
04:16
What risk-reward ratio did the analyzed trade reach?
1:5.62.
14:06
Earning $8,000 in a couple of hours
Demonstrates the potential profitability of the strategy with a concrete example.
00:01Trading only during high-volatility sessions
Key principle: avoid sideways markets and trade when direction is clear.
01:36Liquidity as the core concept
Explains why price reacts at highs/lows due to pending orders.
03:49Waiting for news before entry
Shows risk management by avoiding high-impact news volatility.
09:32Trade reached 1:5.62 risk-reward
Highlights the effectiveness of the strategy when executed correctly.
13:53[00:01] earned me over $8,000 in just a couple of hours. And in this video I'm going to analyze that trade step by step and also explain the trading strategy that has earned me more than $380,000
[00:15] in payouts from funding companies. And as I always like to convey the truth and show everything so you can see that it's completely true, I'm going to leave you with dozens of payments, dozens of payouts with
[00:27] fully verified funding companies so you can see that this trading strategy really works and that you too can make money with it. If you don't know me, I'll introduce myself quickly. My name is Benjamin and I have been dedicating
[00:40] my time to trading for over 7 years. I have been trading with the same strategy for many years and I only trade for 2 hours a day. And in this video you'll see how simple the strategy is and how I'm sure you can get the same results. The
[00:56] strategy is that we're going to use the strategy is that we're going to use the H4 and H1 timeframes to analyze the market. In other words, it is in those H4 and H1 timeframes where we will
[01:08] determine our key points where we have to wait for the price to arrive in order to place our order, execute our trade. In other words, the first thing you will have to do is go to a
[01:20] temporary H4 shift of 4 hours or a temporary H1 shift of one hour. And that's where we'll mark our points of interest. This is extremely important. Something else you need to keep in mind is the
[01:36] market hours. In case you didn't know, at certain times, the price is affected by a huge volume of bank transactions, whether they are sent or received. That's where the
[01:49] interbank algorithm receives or sends the transaction. Therefore, the market volume is much larger and the volatility is also much greater. And it is during these times that we will look for
[02:02] our entries, because in most cases the price outside of these times does not usually find a clear direction and we are not interested in being in the market when the price is in a very sideways range or does not
[02:14] yet have a determined direction, the correct direction. We are interested in entering when the market is already heading in the right direction and we are heading with it in the right direction. This is very important, and you'll
[02:28] obviously wonder what those times are when the price has greater volatility, when that high volume of transactions occurs. Basically, the two most important sessions are the London session and the
[02:40] New York session. The London session runs from 9 a.m. to 11 a.m. Spain time. And in New York, the New York Stock Exchange opens, and has a higher volume of banking transactions from 2 pm
[02:55] banking transactions from 2 pm to 4:30 pm. These times are Spanish time, so if you are from any other country in the world, convert the time to CPT, on Google or wherever, and you will find out what the
[03:08] times are in your country. I'll repeat it for you, from 9 am to 11 am, Spain time, that would be the London session and from 2 pm to 4:30 pm, Spain time, that would be the New York session. Therefore,
[03:23] we will analyze and execute our trading strategy. This now, and I'm also going to apply the trade and analyze it so that you can replicate it, we're going to execute this strategy within these
[03:36] hours. That's where the price will have greater direction and greater volatility, which is what interests us as traders . And something else very important that you will have to keep in mind to execute this strategy perfectly
[03:49] execute this strategy perfectly is to know very well where liquidity? Basically, that's where Where is all the money in the market? Well, in the orders, the stop
[04:02] loss, take profits, pending orders like sell limits, sell stops, by limits, by stops, all the pending orders in the market already have money within them is waiting for the price to do something; there are pending orders, so
[04:16] obviously where there's money, where there are orders, the price tends to react. Because? Because there is a volume of banking transactions, there are monetary transactions of money, basically, so when the price
[04:31] takes those liquidity points, the high probability is that it will tend to react, either to one side or the other. And in the chart, where is this liquidity located? Basically, at every maximum and
[04:44] minimum price in the market. Obviously, the longer the time frame, the greater the liquidity and the greater the probability that the price will react at that point. For this, we will use these timeframes that I mentioned earlier, 4 hours and one
[04:57] hour. I also occasionally check the daily and weekly charts to see where But the timeframes that I consider most important, especially for our intraday strategy, because I open and close trades on the same day, are the
[05:11] H4 and H1 timeframes. For me, those are the areas where the price tends to react much more strongly and where trades usually occur more frequently also very important. Therefore, I have put two examples here in the graph.
[05:24] The first would be the reaction of a liquidity point looking for sales, which is when the price exceeds a maximum, which would be the first example. There are buy [snort] when the price breaks a high because they believe it will continue to
[05:37] rise. Some people have placed their stop-loss there because they entered previously and their stop-loss is placed at that old high. There are also people people with pending orders, so when the price surpasses a
[05:50] previous high in the H4, H1 season, the price tends to react always mentioned earlier, the London session and the New York session. And scenario, which would be looking for purchases. That's where we'll be
[06:05] Well, in contrast to the sales scenario, when the price past low on the H4 and H1 timeframes, on the one-hour or four-hour timeframes, that's where there are also many pending orders, stop losses, day
[06:20] profits, and limit orders waiting to be triggered to either sell or buy. Therefore, the price has a lot of banking transactions, and as a general rule, the price tends to react in those areas of higher
[06:33] liquidity volume. This is also very important. Once and listed have happened, that's where we'll enter a slightly shorter timeframe to have a higher risk-reward ratio and, of
[06:47] course, try to make more money. We'll go to a time frame of between 1 and 5 look for. We're going to look for some very precise confirmations, and in this video I'm going to explain some of them, some that I use, and you'll see
[07:00] how I took that trade. And that trade, mind you, I did n't take it alone, but I did it live and my entire private community, all my students, took it too. In screenshots here so you can see that it's absolutely true. Before I
[07:14] go on to analyze step by step the trade with which I managed to earn more than $8,000 in just a couple of hours, I want you to see another example, in this case in the buying scenario, because the trade I made was in the selling scenario. But to
[07:28] show you that the buying scenario also works, I want you to see this example. This time we are looking at the euro/dollar chart and we are on the 4-hour timeframe and we are going to mark the last low that the
[07:43] price has available. In other words, the price has never reached this point, this minimum. I think this minimum could be analyzed, could be seen by anyone who has been in trading for a very short time. This low point is
[07:55] basically where the price settled and from here this rise began. Therefore, this is a low point where the price has retraced quite strongly. Therefore, it would be an area of liquidity, as I mentioned before. And
[08:09] I want you to see what happens when the price reaches that low. We see money that was pending there, and from there that strong rise begins. The price hasn't gone up from here, or from here, or from here, no. It has
[08:24] risen, it has taken an upward direction when it finally cleared this 4-hour low that it had pending. Because? For the same reason I mentioned before, there were many pending orders here: stop
[08:37] loss, limit orders, take profits, in short, a lot of money, a lot of liquidity. Therefore, the price has a high probability of reacting at trading strategy aims for: for the price to break a low, a high, or
[08:51] are many pending transactions, and then wait for the price to move in the opposite direction? Because many people, when a price breaks a previous low, expect it to continue falling. What does the price usually do when
[09:05] everyone expects it to keep going down? Well, do the exact opposite, go up. Because? Because the vast majority of people who trade lose money, therefore the market has to do the exact opposite of what the
[09:18] vast majority do. And now we're going to analyze the trade, the trade that I took a seeing here? The price has a maximum remaining during the 4- waiting for the price here to look for purchases, in this case we are
[09:32] looking for a maximum. So that? To seek the opposite, to seek sales. explained to you previously. The price pauses here, settles here, and finally generates that big drop, so there is a lot of liquidity here, a lot of
[09:45] transactions waiting for the price to reach that price, to reach that zone. So that? Well, probably to make a pullback, because there are a lot of pending orders here. This trade was taken on May 1st in the
[10:00] New York session. And something else I want to explain to you is that precisely in the New York session at 3:45 pm and at 4 pm, Spanish time, there was some high-impact news, some red news. What does a
[10:13] price can be quite strongly correlated when those macroeconomic data come out, so what we are going to do is wait for these data to come out and based on the release of that data, then we will look for our entry point. Why do we have
[10:28] until these macroeconomic data, these very important and volatile data for the market, are released, the price doesn't really know which very exposed in the market because the price can make
[10:42] very volatile movements that could affect our top positions. Even with a certain direction, given the high volatility of the movement, the large number of transactions when that macroeconomic data, that
[10:56] impact data, is released, the price can move in an exaggerated, highly wait for that data to be released, and then, when the price has reached that point, that peak, we will move to a shorter timeframe. Here
[11:09] we see that the price previously at around 1:30 pm would have already reached that what we are going for is sales, because the sales scenario would already be complete. It breaks a 4-hour high, we're looking for a pullback, we're looking for
[11:24] was waiting for these macroeconomic data to accelerate so I wouldn't be in a trade when there's extreme volatility. Therefore, what I did was wait for that macroeconomic data to come out. We'll
[11:36] price tends to manipulate itself, making everyone believe that it's going to go down now, but look at the price when that macroeconomic data comes out at 4 pm, it goes back to the last high it reached, okay? This
[11:52] maximum that we have pending here. OK? We see that by 4 pm they had already released that data. The upward movement begins again, the peak that would have been generated. And here what we do is go to [snort] the
[12:04] one-minute timeframe and what we are going to look for is for the price to show reached, to look for sells, because we are above the 4- hour high, which is this line we have here, which we have already
[12:17] analyzed. What are we going to look for here? well, a strong price boost. We're going to look for a price that generates momentum, a gap, and in that gap, in that third candles, we'll look for a sell opportunity to position ourselves in a short position in that
[12:32] trade. Here you can see that the price continues to rise; it hasn't yet generated any gap or momentum. And this is where it begins to generate this first impulse. Do you see that it doesn't generate any here? Here it already generates a strong impulse and we would have what
[12:44] we want, which is an imbalance. Here we would have this void. What is a void? Basically, it's an imbalance, something unbalanced, right? third candle in a three-candle sequence, where the first and third candles do not
[12:58] touch. This would be the first, first, second, and third. Do you see that this candle Let's look at it this way so you can see him more comfortably. There you have it. And here we would place our order to look for our sales. Here we could go for a
[13:12] while, risk-reward ratio of 1 to 2, or if we want we can go for the next liquidity point which would be this minimum here, looking for a ratio of 1 to 2. We hit it and as you can see on several occasions the price leaves other
[13:27] has created another void here. You can fit right in here. You can down, this stop-loss is obviously worse because you have to protect yourself at the very top. Therefore, the best thing to do is always to get in as
[13:40] ticket, when you get the confirmations. OK? These are use. I have a few more for other scenarios, for other market situations, but on this occasion this was the one I chose. But on this occasion it was
[13:53] using these confirmations that I have mentioned to you in this same scenario, in this same example. And the price gradually dropped quite sharply. Note that I entered the trade at approximately 4:30, New
[14:06] Spain time, but I'm referring to the New York session . And note that the price reached 1 to 5.62 risk-reward if you had bought this same entry much sooner if you don't want to wait that long, but note that the price reached its
[14:21] having entered at 4:30, that is, in a couple of hours more than $8,000. And as I many of my students in the private group took it too, because I directly gave them a signal to enter sales and it went very well. It's absolutely fantastic
[14:37] analyze, as you've seen. By the way, I invite you to watch a where I've recorded a step-by-step explanation of my trading strategy, in much more liked this strategy and found it relatively simple and
[14:52] the free lesson. It's in the completely free of charge so you can understand this video, please leave a comment, a like, and
[15:04] share it with a friend who also trades. Please also leave comments about so I can take them into account and bring you backtest this strategy, and that you also follow me on Instagram, where I
[15:17] trades I make every day and explain them in a more calm and friendly way through my stories. So if you 're interested, you can free lesson available in the
[15:30] that you backtest it, and that you really put it through its paces .

⚡ Saved you 0h 15m reading this? Transcribe any YouTube video for free — no signup needed.