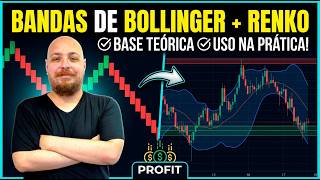

Why the Market Explodes Suddenly
42sOpens with a relatable analogy (Uncle Paul in line) and a dramatic contrast between calm and explosive market moves, creating curiosity about compression and expansion.
▶ Play Clip"Title accurately promises explanation of market explosions and a Bollinger+Renko strategy; delivers practical steps."
This video explains why financial markets alternate between calm and explosive phases, focusing on Bollinger Bands and Renko charts to identify compression and expansion. The presenters demonstrate a strategy for trading sideways markets using Bollinger Bands, Renko charts, and the ADX indicator to filter noise and time entries.
Markets don't move steadily; they alternate between compression (calm) and expansion (volatile). Bollinger Bands behave like an elastic band, contracting during calm periods and expanding during large movements.
This strategy is designed for sideways (range-bound) markets, not trending ones. It uses Bollinger Bands to identify overbought/oversold conditions and Renko charts to filter noise.
Use a 15-tic Renko chart. Add Bollinger Bands with deviation 2 and period 20. Also add ADX as a trend filter; trade only when ADX is below 35 (sideways market).
Enter when price touches a band and the next Renko brick closes in the opposite direction. Stop loss is placed just beyond the last brick's high/low. Take profit is at the opposite band.
Multiple trades are shown: some hit stop loss, others win. The strategy requires patience and filtering; avoid trading when ADX rises above 35 (trending market).
After a breakout, the previous range can act as support/resistance, increasing the probability of a successful trade when price returns to test the band.
Not every strategy works for everyone. Testing and screen time are crucial to refine the strategy and adapt it to personal trading style.
The Bollinger Bands + Renko strategy is effective for sideways markets but requires careful filtering with ADX and strict risk management. Success depends on practice and market experience.
What are the two main states of Bollinger Bands?
Squeeze (compression) and expansion.
01:13
What ADX value indicates a sideways market suitable for this strategy?
Below 35.
02:49
What is the entry rule when price touches the upper Bollinger Band?
Wait for the next Renko brick to close red (down), then enter short.
04:12
Where is the stop loss placed in this strategy?
Just above the last peak (for short) or below the last trough (for long) of the Renko brick.
04:25
Why should you avoid trading at the beginning of the day?
Because the market is usually not moving sideways at the start; it has strong directional movement.
03:44
What does the ADX indicator filter in this strategy?
It filters out trending markets; only trade when ADX is below 35 (sideways).
02:49
Market Compression Analogy
Explains the core concept of market phases using a simple analogy.
00:03Bollinger Bands as a Spring
Describes the elastic behavior of bands, key to understanding the strategy.
01:13ADX Filter for Sideways Markets
Provides a clear, quantifiable filter (ADX < 35) to identify suitable market conditions.
02:49Support/Resistance After Breakout
Shows how to use previous range as additional confirmation for trades.
07:12[00:03] And I am Ricardo. And I have a very simple question for you and for Ricardo here. Because sometimes the market seems calm, without much movement, almost lifeless, like Uncle Paul in the bank line, and then
[00:18] suddenly, bam, life begins , lots of movement. Why is that? That's because the market doesn't move steadily; it alternates between phases of compression and expansion. And today we're going to teach you exactly how to
[00:31] identify when the market is compressed and when it's about to explode in movements. Roll jingle.
[00:45] volatility. They don't show the direction on their own. They show price behavior in relation to volatility. In other words, they don't show whether the market will go up or down. They show exactly whether he is calm or agitated.
[00:59] The bands are composed of three parts: the upper band, the central moving average, and the lower band. In reality, the bands behave like an elastic band, a spring. When the market is stagnant or without significant
[01:13] movement, they contract. And when we have a lot of activity, a lot of buzz in the market, and especially a large movement, they expand. This behavior generates two main states. The squeeze, which is the
[01:26] compression, is the market accumulating energy, and the expansion, which is the market the direction. The market is like Kiko over there, spending more time preparing than actually making any move.
[01:39] In our latest videos, we've been sharing all the strategies and recommending buy or sell recommendations to follow the trend. But the market doesn't always follow a trend. So now this strategy with bodygar bands is
[01:51] more suited to a sideways market, and it depends on your style whether you like working with a sideways market or prefer to wait and only work with a In any case, it's very important that we filter out noise, and for that we
[02:03] 'll use Renco, and also to make visualization easier. Now that the chart is on the screen, let's add the indicators. First, let's change Renco's time, which is currently at 5 minutes, right? So let's put the
[02:18] 15-tic scale in place, shall we? Now right-click, then indicators, bands, and bodygar. We insert it here in the chart. We're just going to edit the band, just to make it easier to visualize. We're not going to touch anything of hers here. Leave the deviation at two,
[02:34] leave the period at 20, it's just basic arithmetic. I'm only going to change the appearance to make it more visible. I'm going to add something that we didn't talk about in our video, which is our ADX. What is our ADX? It's our
[02:49] trend filter. The trend filter will indicate whether or not the market is We want to seek out more laterally oriented markets. So we're going to use the ADX when it's below 35, which means the market is
[03:04] more sideways and therefore tends to move more within one region, right? It goes up, down, up, down, up, down, and stays in the same region. At some point, it's going to issue we were talking about, right? It will compress, compress, compress, until eventually
[03:18] it will become exhausted and burst upwards or downwards. It's going to be our stop, of course, right? However, in the meantime, we'll work until he's sideways. Hey, if it's blowing up somewhere, change your strategy now, you see
[03:31] different strategy. We have several videos here about other several videos here about other trending strategies. So let's take a look here. Let me zoom in a little more this way. I don't recommend working at the beginning of the
[03:44] day because the market is usually not moving sideways at the start, right? It gives off a good vibe, right? You have good strength at the start of the day. On that particular day, April 10th, he didn't have that much strength. And how do I
[03:57] know? It comes from ADX. And if he didn't have the strength, what are we going to do? The price hit the upper band, we're thinking about selling. The price hit the lower end of the spectrum, so we're thinking about buying it. And of course, the ADX has to
[04:12] be below 35, OK? So let's go . The price has reached this point, let's think about a sale, but when are we going to enter the sale? When he makes a red brick, he's finished the brick, and we move on to the next brick. It's closed, that's our
[04:25] entrance. Our stop loss will be placed just above the last peak in the brick. And our gain is in the brick below. In this case , we lost money, right? We can see here that he stopped us. Okay, let's see the next strategy. It did
[04:42] n't quite work here, it's just because it's a little thick. So let's move a little further this way. Beauty. Oh, DX is always down, isn't it? I don't even need to emphasize here that the ADX was down for that entire part of the day. It
[04:55] rang nicely here, didn't it? It rang here. Let's think about when the candle turns green and we enter the next one. It turned green, we moved on to the next one. Our entrance would be here. How do I know this is our entrance? Let's take a look
[05:09] here. Candle stick. Since the graph is frozen, we can't visualize how it was progressing. This candlestick chart will help, more or less, with the explanation for now . So, what would our
[05:21] entry point be? Remember? The green candle has finished , we'll enter immediately afterwards. Our stop is at the brick below, right? The last brick is below, and our game is above. But look at this dirty trick, we
[05:35] above. But look at this dirty trick, we were stopped here before the game even started. So, for now, there are two stops a day, right? But then, right after that, we had the same thing happen again. The green candle touched the screen, and we have another
[05:49] buy signal here. That's when we really got along, right? Finally, right? So we had two stoppages so far, and look, we won the game. Since we're working two to one, for now it's even, we only lost those debts for
[06:04] fees, things like that, right? And we do this throughout the day. There are several operations. If you want, you can use other types of filters. With your studies, we only give you a trigger to think about some strategies, but it's with
[06:17] "Wow, but if I put this other indicator here, you're the one who's going to work on the strategy." Did you see that it made a slight popping sound? Our ADX isn't here, but graphically you can clearly see that the price broke through. If it
[06:32] broke through, it's trending. We're not going to operate here. Even though we're using this ADX filter, we can see that it's not the right time to trade, right? He went up, he's hitting peaks and peaks here. Now is not the time to trade; you need to
[06:45] understand the market. So, look at that , he goes, he comes back to that I'll put the line here again, just to understand what happened. The price to understand what happened. The price went up, it broke through, you know, that range
[06:58] we were operating in. When he returns, he returns to test. This will become a support. If it becomes a support level, it 's not an absurd amount of buying power. Sure, the chart is static, it's easier to do this kind of reading, to
[07:12] understand, but when it does this , in addition to the strength of our strategy that we're going through now, it touches the Bigger band and when it makes a contrary candle, you enter a buy position, this has become a resistance. Look
[07:25] , this line here has become a symbol of resistance . The chances of it working out are doubled . And it really worked. Look, you went long here and the candle went really high, and we're continuing with the trades. Trading
[07:38] sideways isn't so simple either, especially with a tight stop loss. So be very careful. We'll talk a little more about considerations regarding this type of strategy, but it's very important to point out that not every strategy is
[07:50] good. And how will you know that? By testing, you will refine the strategy and find a way for it to work. It all depends on testing and it depends on you. You need screen experience, market experience
[08:02] , all possible help from artificial intelligence, and even our help, right? If you need our Instagram or any other form of communication. And for you to understand, to know how to filter which type of
[08:14] strategy you can use. Final considerations. So, now that we've covered the practical part, keep in mind that this strategy, unlike several others we've discussed in other videos,
[08:27] is ideally used in sideways markets. We're nearing the end of our video. Don't forget to like, comment below, and subscribe to our channel to help us
[08:40] bring you high-quality content here on YouTube. And if you, for example, prefer to operate using strategies that use the trend as the main basis of the operation, don't forget to check out this
[08:55] forget to check out this video and see you next time. M.




⚡ Saved you 0h 08m reading this? Transcribe any YouTube video for free — no signup needed.