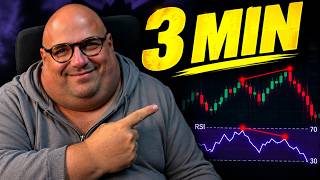

Fat Guy Running Analogy for RSI Divergence
45sThe vivid and humorous analogy of an overweight runner instantly hooks viewers and simplifies a complex trading concept in a relatable way.
▶ Play Clip"The title promises a simple explanation and delivers exactly that with a memorable analogy, though it's more conceptual than actionable."
The video explains the RSI divergence concept using a humorous analogy of an overweight runner in a race, illustrating how price can make new highs while momentum fades. The creator emphasizes that RSI overbought conditions alone are not sell signals and highlights the importance of risk management.
The creator introduces the analogy of a 300-pound man running a 5K race to explain RSI divergence, where price makes a higher high but RSI does not, indicating fading momentum.
The runner's initial burst of speed mirrors RSI pushing above 70, but as he tires, price may still rise while RSI falls back, signaling exhaustion.
The trader waits for the exhaustion signal (RSI divergence) before entering sell positions, not just because RSI is overbought.
A market can stay overbought and continue rising; the creator warns against selling solely on RSI above 70, as they've been 'wrecked' doing that.
RSI is not a magical predictor; it doesn't work every time, so risk management is crucial. The analogy helps visualize momentum fading.
The video concludes that RSI divergence is a useful tool for spotting momentum exhaustion, but it should be used with proper risk management and not as a standalone signal.
RSI Divergence Analogy
Provides a memorable, intuitive explanation of a technical concept.
Overbought Misconception
Corrects a common trading mistake about RSI overbought signals.
02:08Risk Management Emphasis
Stresses that no indicator works all the time, highlighting the need for risk control.
02:42[00:00] I've been trading RSI divergences for years, and instead of giving you some complicated explanation of momentum and price action, today I'm going to explain why the RSI divergence, in my opinion,
[00:12] works using a fat guy running a race. Bear with me. I love analogies. Imagine you've got this big fat guy. He's 300 pounds. He hasn't exercised since 2007, but for some reason today he decided
[00:26] that I'm gonna run a 5K race. The race starts and this guy is flying. He's giving it absolutely everything. This is basically what we're seeing when the RSI pushes up super fast, super aggressive,
[00:41] price is moving, RSI is just railing up. There's a huge amount of momentum behind the move and somehow our guy is still going. But after a while, something starts happening. He starts getting tired. He's breathing like a broken vacuum cleaner.
[00:55] His legs are giving up, his face has turned a color that probably requires medical attention, but he sees the finish line. So he thinks to himself, I'm finishing this damn race. And he finds one last burst of energy.
[01:09] And here's the very important part. He's actually running farther than he did before. Price is making a new high. So if you were only looking at Price, you'd say, look, he's going higher. The trend is strong. He's going to finish.
[01:22] Except look at the guy. He literally fucking dying that final push of his may have gotten him a little bit farther But you can see that he is physically exhausted He is done And that what I see when I look at the RSI divergence Price makes a higher
[01:39] high. The RSI doesn't. The first push took the RSI outside of the 70 level. Then price pushed higher, except this time the RSI has already fallen back inside. To me, that's the exhausted runner. Price
[01:52] is still moving forward, but the momentum behind the movement is fading. And that's the part that I'm interested in, capitalizing on the weakness, because I'm not entering any sell positions just because the RSI went above 70. I've done that and I got wrecked. RSI being overbought
[02:08] doesn't mean sell. A market can stay overbought and continue ripping higher and faster than you've ever seen before. Our fat guy example might be the greatest endurance athlete that has ever lived, but I'm still going to wait for him to get tired. I want that initial powerful move. I want him to
[02:24] waste his energy. I want him to give it that last rush of effort because you can see with the RSI when price is exhausted. And the same thing works in reverse. Now imagine our fat guy running downhill. Actually, don't do that. It's going to be funny. But you get the point. RSI is a momentum
[02:42] indicator. Don't ever let anybody tell you otherwise. Follow the momentum. Not a magical indicator that predicts the future. It doesn't even work every single time. That's why it's important to have really good risk management. So take it all with a grain of salt. Just a funny
[02:55] analogy that I like to think of when I'm trading. And the next time you see price making a higher high, but the RSI can't, think about the fat guy running the race.




⚡ Saved you 0h 03m reading this? Transcribe any YouTube video for free — no signup needed.