
Share Buyback Valuation in Excel
45sEducational finance content with a clear step-by-step demonstration is highly shareable for aspiring investors and students.
▶ Play Clip"Title is accurate — an instructional demo with a practical model; slight padding but delivers on its promise."
This video demonstrates a share buyback valuation model in Microsoft Excel, specifically for buybacks made with excess cash. The creator, Magnus Petersen, shows how the effect of a buyback depends on the relationship between the market price and the intrinsic value per share.
Short Excel demonstration of share buyback valuation; spreadsheet downloadable via link.
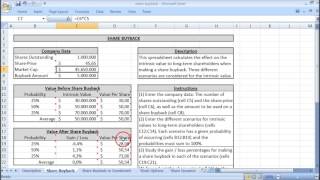
Scenario: buyback for excess cash. Inputs: 1 million shares outstanding, price $50/share → market cap $50M; buyback amount $5M.
Intrinsic value = excess cash (payable as dividends now) + present value of future earnings (payable as future dividends). Three cases with probabilities.
Case 1 (25% prob): loss −7.4% → $27.78/share. Case 2 (50% prob): no gain/loss. Case 3 (25% prob): gain +3.2% → $51.60/share.
Average intrinsic value per share after buyback equals market cap ($50M) but average loss is −1.1% because loss magnitude exceeds gain magnitude.
Equilibrium price = $45.65; at that price average gain/loss = 0%. Below equilibrium → average gain; above → average loss.
To ensure no loss, share price must be below the lowest intrinsic value per share before buyback ($30). E.g., $29 gives worst case +0.7%, average +7.6%.
At $50 (mean equilibrium), average intrinsic value after buyback equals $50/share, same as before. Intrinsic value is unknown (future earnings), so experiment with assumptions.
Relative Equilibrium
Provides a practical threshold to evaluate whether a buyback is accretive or dilutive on average.
03:00Guarantee Against Loss
Shows how to avoid losses by pricing below the worst-case intrinsic value — a useful risk-management rule.
03:51Sensitivity to Assumptions
Highlights the uncertainty of intrinsic value and the need to test multiple scenarios.
04:21[00:00] Hello, my name is Magnus Petersen. This is a short demonstration of share buyback valuation in Microsoft Excel. You can click on the link below the video to download the spreadsheet.
[00:12] This is the scenario where the share buyback is made for excess cash. First, we have to enter some data for the company. We have the number of shares outstanding, and we set this to 1 million,
[00:25] and the price per share is set to $50 in this example, and this gives a market cap which is the market value of all the shares outstanding of 50 million dollars let's say that the buyback amount is 5 million dollars the effect of the share buyback
[00:43] depends on the value to long-term shareholders before making the share buyback we call this the intrinsic value and it is a excess cash that can be paid out as dividends now plus the present
[00:55] value of future earnings that could be paid out as dividends in the future. We considered three cases for the intrinsic value. And the first one has a probability of 25 of occurring We say that the intrinsic value is million which gives an intrinsic value per share of The probability of the second case is 50
[01:20] and the intrinsic value is assumed to be $50 million, which is the same as a market cap. And the last case has a probability of 25% of occurring,
[01:33] and we say that the intrinsic value is $70 million. dollars. On average, the intrinsic value is $50 million, which is the same as a market cap. Now let's see what happens when we make a share buyback for $5 million.
[01:46] So in the first case, which occurs with probability of 25%, we have a loss of minus 7.4%. And this gives an intrinsic value per share of $27.78. In the second case, which has a probability
[02:02] of 50%, there is no gain or loss because the intrinsic value equaled the market cap. In the third case, which has probability of 25% of occurring, the gain is 3.2%, which
[02:17] means the intrinsic value per share after the share buyback is which is up from before the share buyback On average the intrinsic value per share after the share buyback is
[02:32] And this is because intrinsic value per share before the share buyback was the same as a market cap. But on average, the loss is minus 1.1%. And this is because the first scenario has a loss of minus 7.4%,
[02:47] which is much greater than the gain of 3.2% for the third scenario. And when these are weighted by their probabilities of occurring, the average loss is minus 1.1%.
[03:00] This down here is called the relative equilibrium, and it is a share price of $45.65. And if we go up and set the share price to 45.65,
[03:14] we get an average gain or loss of 0%. So that is what this relative equilibrium means, that when the share price equals this equilibrium,
[03:26] the average gain or loss is 0. And if the share price is less than the equilibrium, like so, then we have a gain on average But notice that we still have a probability of 25 for a loss of minus 6 If we want to guarantee that no loss occurs then the share price must be lower than the lowest
[03:51] intrinsic value per share before the share buyback, which was $30. So let's try and write $29 here. and then we have in the worst case that the gain is only 0.7% but it's no longer a loss and on average
[04:07] the gain is 7.6% per share. The mean equilibrium is $50 per share and this corresponds to the average intrinsic value per share before the share buyback. So if we set it back to $50
[04:21] we again get an average intrinsic value per share after the share buyback of $50, which equals the $50 before the share buyback. We don't know what the intrinsic value is because it depends on the future earnings,
[04:36] which are unknown. So you should experiment with different assumptions for the intrinsic value and the probabilities of occurring, and see how it affects the intrinsic value after a share buyback.
[04:48] You can download this spreadsheet by clicking on the link below the video.
⚡ Saved you 0h 04m reading this? Transcribe any YouTube video for free — no signup needed.