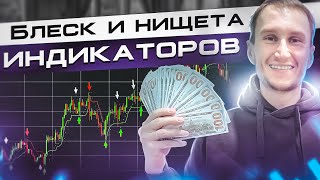

Indicators Won't Give You New Information
40sThe provocative God-versus-schizophrenia analogy makes a complex trading concept instantly memorable and shareable.
▶ Play Clip"Delivers exactly what the title promises: a blunt, experience-based breakdown of which indicators are useful and which are junk."
In this stream, veteran trader Artem (trading since 2008) breaks down the realities of technical indicators for beginners. He explains what indicators really are, why they never add new information, and why trend indicators and oscillators each fail in the wrong market phase. His core message: stop chasing magic indicators and learn to read the price chart itself.
Artem spent years and lost money hunting for a secret indicator or strategy that would guarantee income. He found nothing until he started reading price charts, and warns beginners not to repeat his mistake.
An indicator is a mathematical formula or function that processes quotes into a certain form. A trader uses the resulting data to try to predict subsequent price movement and to track other market changes.
Everything an indicator shows on the chart is already present in the quotes and price action. Indicators do not reveal hidden data; they merely reprocess existing information.
Indicators process raw market data: the price chart/quotes, vertical volumes, delta (difference between buy and sell orders), market depth limit orders, and volume clusters.
All technical indicators can be reduced to two types: trend indicators and oscillators. A third type (channel indicators) was skipped to avoid confusing beginners.
Trend indicators work under conditions of constant and systematic price changes. A classic example is the moving average, one of the oldest indicators used to identify average price levels.
If average apartment prices are 10 million rubles and one sells for 6 million, it is objectively cheap. Similarly, when price falls below a moving average, it may represent an undervalued buy opportunity.
A common strategy is to use a fast moving average (e.g., 50) and a slow moving average (e.g., 200). If the fast MA crosses above the slow MA, buy; if it crosses below, sell.
In a wide sideways market, moving averages generate many false entry signals and it becomes impossible to make money. This is the main disadvantage of trend indicators.
Oscillators like RSI and Stochastic work in corridors and sideways markets. When the market leaves the oversold zone, buy; when it leaves the overbought zone, sell.
In a trending market, oscillators produce many false signals. For example, in a downtrend the oscillator may repeatedly recommend buying, leading to losses if followed.
Many traders add so many indicators to their charts that the price chart itself disappears. Students at his school often arrive with overloaded charts and have to be retrained to remove indicators.
All indicators are inherently delayed because they process historical data. This delay means signals often arrive only after the trend has already run its course.
Artem offered $10,000 plus 70% of his exchange profits to anyone who could provide an indicator that predicts market phase changes in advance. No one delivered a working solution.
Indicators can serve as useful assistants for traders who already understand the market, but they will confuse and cause losses for those who don't. There is no 100% reliable magic indicator.
Indicators are not a shortcut to profits; they are just processed price data that lag the market. The only reliable edge comes from understanding market context and reading price action, using indicators only as assistants.
Telegram channel
link
Olymp Trade
service
Extabit
service
Moving average
tool
Bollinger Bands
tool
RSI (Relative Strength Index)
tool
Stochastic oscillator
tool
Alligator indicator
tool
Ichimoku indicator
tool
Fibonacci retracement
tool
Bill Williams
person
Ken Ho
person
Bison
person
Trading course 'The Grail of Real Trading'
service
What is a technical indicator according to the video?
A mathematical formula that processes quotes into a certain form, which traders use to try to predict price movements.
01:53
What are the two main types of technical indicators?
Trend indicators and oscillators.
04:41
In what market conditions do trend indicators work best?
In conditions of constant and systematic price changes (trends).
05:11
What is the main disadvantage of trend indicators in a sideways market?
They produce many false entry signals and cannot generate profits.
11:33
What are the two zones of an oscillator (like RSI) that traders watch?
The oversold zone (lower border) and the overbought zone (upper border).
16:13
Why do oscillators fail in a trending market?
They give many false buy/sell signals.
16:55
What did the speaker offer to anyone with an indicator that can predict market phase changes in advance?
$10,000 plus 70% of the profit he would earn on the exchange.
30:15
Why did the speaker abandon indicator-based trading even though a partner had a successful indicator strategy?
Because all indicators are lagging, and they cannot be made non-lagging.
26:11
According to the speaker, what is the only way to use indicators effectively?
If you already understand and read the market, indicators can serve as assistants; otherwise they confuse and cause losses.
31:36
What happened with the 'Ylang-Ylang 16' robot based on a moving average?
It worked brilliantly until all the money was lost; the speaker advises withdrawing profit at least weekly if you use averaging.
38:41
Indicators give no new information
This reframes indicators as reprocessed price data rather than secret tools, which is the foundation of the entire lecture.
02:52Two types of indicators
A simple mental model that helps beginners organize all technical indicators into just two categories.
04:41Trend vs oscillator market fit
The key principle that trend indicators work in trends but fail in flats, while oscillators do the opposite.
18:29All indicators are lagging
This explains the inherent delay in indicator signals and why they often appear after the move is over.
26:11No indicator predicts phase changes
The $10,000 challenge proves that no known indicator can forecast trend-to-flat transitions, debunking a common trading fantasy.
30:15[00:03] Telegram channel. The link is in the description. The second link is also in the comments. Please go and join our Telegram channel. Please go and join our Telegram channel. Then, if YouTube does
[00:17] block me, I'll leave a message there. We'll meet up. Maybe we'll meet right there on Telegram. Today, we have fairly simple streams and a fairly simple lecture. It will be dedicated to indicators.
[00:31] If you're a beginner, this will definitely be useful to you, since I'll save you a useful to you, since I'll save you a energy, and money today. Since in the past, I spent several years searching for
[00:45] some secret indicator, a secret trading strategy that would definitely work and bring income in the market, naturally, I found nothing until I started reading price charts. Today, I'll give you general
[00:59] information regarding indicators so that you understand. If you still decide to look for it, dig in this direction. Try your luck, so to speak. At least you'll understand what exactly you need to look for. If you're watching me for
[01:13] the first time, my name is Artem. The stars are the most famous on the stock exchange. traded since 2008, director of the online trading school, author of the course "The Grail of Real Trading", book, many publications, website, this YouTube channel that you are watching now, and
[01:28] also one of those who systematically gives comments to the media. If you are watching me for the first time, please subscribe to the channel and also go to the channel profile to watch some other videos. I think you will definitely
[01:40] find something like Simon on the questions that you are researching. So, we already have a fairly large number of subscribers and many of them have already changed their trading as a menu. Let's first define what an indicator is in general. An
[01:53] indicator is a mathematical formula, a certain function that processes quotes into a certain form. Having received data from this indicator, a trader tries to predict subsequent
[02:10] niacin and also uses indicators to track news, for example, changes in other markets that can also affect the price of a plus thread. Who has heard of such a term called an economic indicator? Please put a plus
[02:26] and put a minus if you haven't heard of it. I am saying this because today we will be looking at technical indicators with you, but in addition to technical indicators, there are also Economic indicators that
[02:39] show slightly different statistics on penetration, as we will discuss next time. Today we are talking purely about technical matters. That is, there is no secret knowledge in is, there is no secret knowledge in indicators. Everything that
[02:52] this or that indicator shows on the chart is already a processing of the information that is available to you in this new system. No new information
[03:04] appears. You know how to check and communicate with God or do you still have communicate with God or do you still have schizophrenia? If God can answer a schizophrenia? If God can answer a riddle or question
[03:17] that you don’t know the answer to, then most likely it is God. But if you can’t, if your is schizophrenia. Here, approximately the same thing happens. Indicators do not give you any new information. All the information
[03:32] shown by the indicator already exists on the chart, and this is important to take into account because in the future you will constantly encounter this. What information do indicators process? Of course, this is the price chart, that is, the
[03:48] price chart itself, the quotes themselves, and the quotes themselves are vertical volumes. This is the delta, that is, the difference between buy orders and sell orders. This is some information from the market depth, for example, the number of
[04:02] limit orders placed, and this is a volume cluster. That is, for example, the prices at which certain ones or others passed, but some volume, without going into details, it is
[04:14] clear that often you will encounter an indicator that will process the price chart. There are some quotes, they are processed in some way, and the indicator gives you some value. These are the
[04:28] five primary indicators and five elements that usually make up the elements that usually make up the market. If all indicators are reduced to a certain common denominator, then they can be conditionally divided into only
[04:41] two types: trend indicators and an oscillator. There is also a third type called channel indicators. We will not consider this today so as not to mislead you. Let's, if you are a beginner, concentrate
[04:56] for now on only two: trend indicators and oscillators. These frames are up to 1 liter. Let's figure it out at the beginning. Bench trend indicators work under conditions of constant and systematic price changes, higher or
[05:11] lower. A striking example of such an indicator is moving averages. Anyone who has heard of a moving average should put a minus sign. Who doesn't know something like that? A moving average is one of the
[05:24] oldest indicators that can be encountered at all. I don't even know what to set up the indicator for us today we will be looking at on the trading resource and if you have some
[05:40] other terminal, yours may be different somehow here you need to go here accordingly, I apologize and in technical write moving averages here is the moving average
[05:57] we set the moving average with you we set it next click on the gear and here we select the period here there is a large one in general there are
[06:11] big debates among traders many traders set different periods of moving averages on this principle many trading strategies are built let's set up a 200 moving average how the
[06:24] moving average works the moving average gives you some average value hitting the formula and a complex explanation it's just on the floor just the average price here is the average price for this is definitely Perry Imperio then in our
[06:39] case 200 for 200 bars the average price was approximately this then this such and such and useful this average prices and accordingly we can make this or that decision so for example again if Let's say,
[06:54] from the market a little, let 's say you want to buy an apartment, for example, and in your city apartments cost one-bedroom apartments, let's say 10 million
[07:06] rubles, this is the average price, for someone it may be more, for someone it may be less, but on average, plus or minus 10 million rubles, and then you notice some one-bedroom apartment that is being sold, for example, for 6 million
[07:20] rubles, the price is objectively low, that is, low below the average price, what will you do, what will you do, write in the chat that you excellent apartment, everything is in order with the documents, it is understandable that such a price
[07:36] will arouse some suspicion in you, everything seems to be a normal seller, good ones everything seems to be a normal seller, good ones there, some auntie, but at the same time the price is much lower than the average price, what will you do at this moment I do
[07:51] n't know what you will do, you are writing for now, but personally, I will buy because the price is objectively low and accordingly, for me as a buyer of this very one-bedroom apartment, it is profitable to buy this apartment and it is
[08:06] naturally profitable to make money on this exactly the same thing happens in the market if we have some kind of moving average and the price For example, in my particular case,
[08:18] let's look at this example with you. Here's a moving average at the moving average at the moment, the price approaches this moving average from the bottom up, that is, we are saying that
[08:35] that is, we are saying that we have approached the average price area, and at the moment, in relation to previous prices, the market is now expensive. It's like selling an apartment. For example, you have reached an area where, on average,
[08:51] apartments are below the average price, for example, without girls in the city, it costs 10 million, but here there is an area where apartments on average cost, for example, 8 million, and here you see that someone is selling for 10 million. What will you
[09:04] do? Will you sell here? The same thing happens in the market. If your price approaches the moving average from the bottom up, traders usually expect a
[09:16] subsequent downward movement here, that is, some kind of rollback to the bottom and perhaps even some kind of rollback to the bottom and perhaps even some kind of big reversal. If some kind of big reversal. If our price moves, on the contrary, it moves from top to
[09:30] bottom, then in this case we are saying that our price is too cheap and we further expect some kind of even small specific reversal. This is how it is traded by a moving average, that is, conditionally speaking, we can take some
[09:46] movement to the moving average here to look for some entry points before a reversal, but if the market, for example, breaks through this moving average, we will wait somewhere around here from some entry point in order to take the subsequent
[10:00] reversal. There are also all sorts of trading strategies that use several moving averages. For example, you can add here, let's add a moving average and let's have one moving
[10:14] average with a period of 200 and another moving average with a period of 50 moving average with a period of 50 and let's paint it in a different color. Well, let's say, for and let's paint it in a different color. Well, let's say, for
[10:29] this case, I almost didn't lose my train of thought. In this case, a moving average with a period of 50 is also called a fast moving average. If we see that the fast moving average breaks through, well, as you
[10:44] moving average with a period of 200 from bottom to top, we need to buy. If from top to bottom, we need to sell. This is one of the trading strategies that
[10:56] you can, in principle, somehow use, but here we go to the very use, but here we go to the very beginning of this cloud of information. Trend indicators work if you pay attention in
[11:08] conditions of constant and systematic price changes. Above and below, speaking more indicators only work in a trend.
[11:20] Note how we added a moving average here. The market was in a trend, and note how the market gave a huge number of rebounds. That is, but we could sell here and make money on this. We
[11:33] could sell here and make money on this, but let's go back to a little different place. Let's say here, and when the market is, for example, in such a wide flat. Pay attention to how many false entry points
[11:47] how many false entry points this indicator shows. When the market is in a sideways trend, unfortunately, trend indicators do not work, and you will not be able to make money on them. This is the main disadvantage of trend indicators.
[12:00] main disadvantage of trend indicators. Another problem is that sometimes it is very difficult to say when the market has crossed the phase of a sideways trend, and it is difficult to somehow interpret this. Have any of you already tried to
[12:14] make money on moving averages? They write that this is not for binary options. I would disagree with you. I have met some people who tried to use this on binary options, but since binary options themselves are a
[12:28] complete tool, in general, not a very good thing. Better Of course, there is no way to trade there at all in principle. Has anyone tried using moving averages for trading? What strategies have you used? I
[12:43] used this approach at one time, that is, I used several moving averages and accordingly tried to trade them. I tried to look for a certain pattern. I didn’t really find any patterns. Unless you can
[12:59] use, for example, a 200 moving average to determine the general trend, that is, where the market is moving as a whole, and some slow moving average, I apologize, a fast moving average in order to determine a
[13:13] specific entry point. Well, for example, let’s look at this example: the market is in a trend and we see that the market breaks through the slow moving average from the bottom up. Therefore, here I will only look for
[13:27] buy trades. I will not try to look for sell trades. Now I add, I said 50, I apologize, 33. I should have added apologize, 33. I should have added 33. I add the 33 moving average and
[13:45] try to look for entry points. The market approaches this moving average. I enter a position. The market approaches again. I enter a buy trade again. But if the market breaks through from the opposite side, I do nothing. That is, I wait for the
[13:58] outcome, the market goes through some kind of flat, for example, and here use this, let's say it works with a general understanding of the market, but I'll talk about this a little later. For short terms, you can use stochastics. Let's
[14:13] just host with you and talk about stochastics. Yes, you write correctly that there is too much noise in the moving average for automation and, unfortunately, it will not work. This is how it is normally
[14:27] programmed to make money on it. The next type of moving moving indicators are oscillators. Oscillators work in conditions of constant and systematic price changes in the corridor. That is, if earlier we
[14:43] talked about trend indicators that work great in a trend and you were living proof that the moving average works great in a trend, but unfortunately, in a sideways trend it loses. But oscillators work the
[14:59] opposite way. They work perfectly in a sideways trend, but at the same time, in a trend, they will give many false signals. Let's now put an oscillator here with you and add. Let's put with you the ERSAI relative strength index, the so-called
[15:16] word to say. There are a great many oscillators, some trend-based,
[15:28] add a stochastic since we already have a stochastic relative strength oscillator. It will add a stochastic to the place of Eros. And since we've already written the place of Eros. And since we've already written about the moving average, please forgive me.
[15:42] Oscillators, pay attention to how this oscillator works great in a sideways market. Yes, we have a sideways market. Let's assume there's a section of a sideways market underneath us. We note that this all works
[15:58] well. We are recommended to do this if the market is here, the so-called oversold zone, that is, this lower border. If the market leaves the oversold zone, we are recommended to
[16:13] If the market is in the overbought zone, this is the upper area, and the market leaves this area, we are not recommended to sell. Let 's find some ideal example. For example, the market approaches
[16:28] this area, is in the oversold zone, leaves it, we need to buy. It works great. Here, the market reaches the overbought area, begins to leave it, that is, go in the opposite direction. We are
[16:40] recommended to sell. We could also make money on this here. we would have gone into buying too, we could have made money on this, here we would have gone into selling, we could have made money on this, well, let's now turn to the section of the market
[16:55] where there is a trend section, let's now change, everything here was closed for me, one moment, something, I clicked everything here, so to speak,
[17:07] one moment, 1 moment, for now, ask questions, I for now, ask questions, I clicked something wrong here, so let's
[17:32] pay attention, let's say, to this section of the market, here, here, the market is in a trend, the market is in a trend, it's going down, pay attention to how many false signals the market gave here, here is one of the false signals,
[17:46] pay attention that here it would have recommended us to go into buying if we had gone into buying here on the trend, we would naturally have lost money on this, a little further, the market again gives us many false signals, it recommends us to
[18:00] continue selling here, if you, we sold bombs here, we also lost money on this, this is, sold bombs here, we also lost money on this, this is, we often say that using indicators in their bare form is very, very
[18:14] using indicators in their bare form is very, very problematic, one can say that such a word would be appropriate, but it is impossible, food in In some ways, it's even impossible because, unfortunately, all the indicators are working, but they only work in certain
[18:29] market formations. And here again, let's consolidate the material in the warehouse. The moving average works great in trending market segments, but unfortunately, it works poorly in a sideways market. The moving average, for example,
[18:45] works great in floats, but works very poorly in trending market segments. If you really go in this direction, then over time you will notice how you add so many indicators to your chart
[19:01] that you won't even have a price chart left. And if you think that this is some kind of joke, am I kidding right now? I'm making something up here. Believe me, this is far from a joke. A huge number of students come to our school, and often when
[19:17] our students just come to our school, their photos usually look similar. Naturally, if they come to us, they don't earn anything. Otherwise, there would be no point in buying funds for our training. They have to be
[19:32] retrained, and we have to force them to remove all these force them to remove all these indicators. Because, unfortunately, traders here are faced with the fact that it is not clear what exactly is the matter. Brackets.
[19:45] Which indicator to work with and where exactly to enter and so on. In addition to these two areas in the food of trend indicators and also oscillators, there are also proprietary indicators. There are working indicators
[19:59] that can really bring you some kind of stable profit, but as a rule, such indicators are developed for specific instruments, specific time frames and a specific deposit size and are developed by a specific person,
[20:13] that is, directly by you. I don’t know if we have Bison in the chat now. He is one of the so-called guards of our channel who makes money on one of the
[20:26] indicators and he has slightly tweaked it for his own purposes. for his own purposes. This indicator is called correlation and so he can use it because he has his own time, a kind of
[20:40] proprietary trading strategy. Of course, you do n’t know who Bison is, you don’t understand what I’m talking about now, but to grasp its general meaning, if you have some kind of proprietary trading strategy based on proprietary indicators,
[20:53] use it perfectly. But if you are now going to watch some webinar, mine or someone else’s, or someone is selling some kind of this, for example, some kind of indicator or something. In this spirit, you are trying to
[21:09] buy this and make money on it. There is a high probability that the purchase of such indicators will not be crowned with any success. You will lose money on this. success. You will lose money on this. You will not be able to find a good indicator
[21:24] that will work in every condition and in every market phase. Each dictator will work with varying success, and some indicators will work in a
[21:36] work in a flat. In order to operate these indicators and their brothers and earn some signals from them, you need some kind of original trading strategy, and this assumes that you have an understanding of the knowledge of what
[21:52] exactly you will be doing and, most importantly, your experience. You will not be able to importantly, your experience. You will not be able to find an indicator without knowing anything that will draw some arrows for you and you will not be able to make money on this. You will not be
[22:07] able to use such a format. Drop this idea. I also spent three years on this at one time, to be more precise, two years. I was really bothered by this trying to find some kind of indicator and I found nothing. You will not find anything either.
[22:23] I gave a huge amount of money to all these sellers of air who were selling some wonderful, some magnificent indicator. You buy it, and in the end You'll get complete crap and the loss of your deposit, so don't go
[22:37] in this direction. You're guaranteed to lose money 100%. You can buy indicators, you can develop them, trade, and some of your own indicators. If you understand and read the market, if you know how to
[22:53] do this, if you know how to trade, then yes, then indicators are for you. They can help and I can serve a good service, so to speak, but in all other cases, this is service, so to speak, but in all other cases, this is obviously a dead end, and you will
[23:08] obviously a dead end, and you will lose a huge amount of money on this. Listen to what I'm telling you now, no matter how sadly strange it may sound to you, etc. I understand that many will now write me angry
[23:21] messages whenever I speak so categorically. Many write me angry messages. Let me just show you, for example, I'll just give you my example. Please note that this is my workspace,
[23:40] how my charts are set up. Please note that I have the indicator set here. I have the moving average set here, and also the so- called Bollinger Bands. Bollinger Bands work great, just like the
[23:54] moving average works, but this does not mean that I will trade directly with these Bollinger Bands. For example, let's assume that you have this situation. If here I see the market moving towards
[24:08] this band, the patient, as an example, is in this phase, I will not look for sell trades here. Why, because in this particular case, we already have a reversal of this small trend, here we have a downward trend, the market
[24:23] is in a complete reversal, and no matter what the indicator shows me, I would ignore it all. To understand when to ignore the market and when to trade using some indicator, you need experience, you need understanding, and you need knowledge.
[24:39] moving averages once today, in 2016, I deposited money. I don’t know if you know or not whether you remember such a broker, Olymp Trade, I deposited 100,000 rubles and traded currency pairs during the Asian session.
[24:56] Why did I trade currency pairs during the Asian session? Yes, because during the Asian session, the market is in such a tight sideways range, and then you could put a terrace, for example, or a stochastic, and don’t even think about it, but
[25:10] trade at the same time. But back then, I didn’t yet know that all this Olymp Trade and other binary options yesterday are complete [ __ ] because the broker then puts a spoke in your wheel. The broker simply tweaked my payments and trading
[25:25] strategy. stopped working but nevertheless, we will not try to nevertheless, we will not try to outsmart the market and will use only the information that the market gives us directly, do not distort it with
[25:41] indicators, therefore, we will analyze a chart, for example, Japanese candlesticks using price action, volume, delta, and so on. Why did I stop at this path for a while, so to speak, why did I not go into indicators, although again, I had
[25:58] my time with a finger, a partner who provided me with a trading strategy that worked just great on an indicator, a complete indicator, but why did I abandon it? Because all indicators, in addition to all the disadvantages that I listed with you,
[26:11] they are also damn lagging and you cannot change this so that they do not lag. If I now show you, for example, the same chart of mine that I showed you one moment, 1 moment, I will show you now the chart
[26:28] moment, 1 moment, I will show you now the chart that we just looked at.
[26:40] let it be this chart, let's add it here, let's add a add it here, let's add a moving average here, let's say, let's
[27:37] for some reason, I don't see indicators here, I average well okay okay I wanted to show you a
[27:51] small example moment let's then this is all done training this is all done training this is also something clicked
[28:10] some kind of trading strategy for free without registration sms and make money on it but guys it won't work it won't work you will still have to
[28:22] study this direction somehow research all this but it won't work all this but it won't work so let's do it together like this so let's do it together like this
[28:35] add 200 pay attention here is the same trading strategy that I talked about literally a couple of minutes ago when the market, for example, crosses the moving average we need to
[28:49] look for a sell deal here pay attention the trend is already at the end stage here the trend is already ending and only then the market ending and only then the market sends us a signal to sell or here here
[29:02] we need to buy but from the point of view of this trading strategy again pay attention to this moment the market is already the limit a huge number of points and only then in fact at the end we are offered to
[29:18] buy and here is also an example here we need to sell only better by the time when we have already had a climax of sales when we have already stopped the downward trend we need to sell and this is what they call it and there is a
[29:33] constant delay, unfortunately, it is impossible to use indicators in their bare form, you cannot, unfortunately, also find no matter how much you would like it, you cannot find an indicator that would tell you, for
[29:48] example, market changes. Let's say you know that moving averages work great in a trend, oscillators work in a flat, it seems to you, but why, for example, do n't I now find, say, some
[30:02] indicator that would tell me, bro, now your market is going to change and now you need to use, for example, instead of a moving average, use some oscillator. There is no such
[30:15] indicator that could predict changes in the market phase in advance. On my channel, I once released several videos where I offered people if they had a similar indicator, I offered him to buy this very indicator, and I
[30:30] offer pass on crazy conditions, that is, I offered 10,000 dollars immediately to the person who would sell me this indicator and I also offered 70 percent of all the profit that I would earn on the stock exchange. Imagine the
[30:45] capital and, of course, I have a huge one, that is, a person could not work his whole life if he provided me with such an indicator. or it was somehow invented, developed, and so on, no one in all this time wrote an opinion,
[30:58] one person, two people, I apologize, wrote themselves, merged, that is, by the time I provide, so to speak, some kind of proof, they merged. If you have such an indicator, my offer is still valid, $10,000, I will give you 100%,
[31:11] $10,000, I will give you 100%, but regarding 70% of income from the exchange, maybe now I will give a little less, but nevertheless, if you have such an indicator, share it, I will buy it from you, I am 100% sure that no
[31:23] one from, respectively, the person who watches me does not have such an indicator, therefore, indicators, unfortunately, are a path to nowhere, they can serve you well if you understand the market, but if you do not
[31:36] understand the market, they will only confuse you and, unfortunately, will not be able to provide you with anything really, that is, you will unfortunately lose money on this, therefore, my initial advice to you is to simply monitor the market, you will not be able to find a magic
[31:52] indicator that will work 100 %, you will not be able to find a strategy for an indicator that will always work 100%, and each indicator requires an operator who will filter the signals and Make the
[32:06] final decision Remember, I told you literally a minute ago that I had a partner who developed a trading strategy designed only for indicators and which, well, it justified itself quite well, so to speak. I
[32:20] told you that I do not use this trading strategy, but my partner still uses it. My partner knows the market very well. He is a former student of mine. He reads the market very well, even better than I do. For him, this is a kind of assistant
[32:33] better understand the market situation. Make trading decisions if, for example, for some reason, the indicator gives you a signal, but it sees that it is not the right simply does not take this trade. Well, I hope I was able to tell you about the
[32:50] brilliance of the poverty of indicators that can bring you a lot of money if you know what they are doing and not only bring you nothing, but also cause you losses if nothing, but also cause you losses if you do not know what to do responsibly. What
[33:02] else can I recommend to you? We now have a great discount on all our training products. It was timed to coincide with Knowledge Day, but Knowledge Day has already passed, and the discount, so to speak, remains. It ends in 12 days. In fact, the
[33:19] last week remains when you can take advantage of this discount and, most importantly, start earning little by little. Money in the market is training in active trading with which you will firstly create your own unique
[33:32] trading strategy based on the knowledge contained in these training courses, secondly, learn to read the market and thirdly, learn to make money in this very market from anywhere in the world. You can, as in the saying goes, steal a
[33:48] [ __ ] tractor, leave Russia, so to speak, and trade from anywhere in the world. Unfortunately, this is a very common question now: can I trade somewhere in another country? You can, we have many students who have left for other countries
[34:01] now, they are trading on the other hand, I do not support these options, by the way, you still need to figure it out in your own country while being directly in your own country, but that is a separate story, a matter of politics. In any case, this does
[34:15] not prevent them from trading on the exchange and, most importantly, trading successfully on this very exchange. We currently have a discount, take advantage of this discount, learn to read charts, you will earn little by little, and we work completely in the
[34:30] white hat. We have an official license that allows us, and earnings on accordingly, to sell training products. A license for an receive An official receipt for payment, login and password from our own
[34:46] educational platform. You are not just buying a course, you are buying an entire platform, essentially an educational one. It is our own, tailored specifically to the tasks we have set out to make it convenient for our students.
[35:02] Your personal account will contain the courses you purchased. Here are the courses that we have. In general, at the school as a whole, you will have the courses you purchased. This is my personal account. Of
[35:15] course, I have all the courses. Each course is divided into chapters. A brief description is given here to help you understand what the help you understand what the chapters are all about. Well, in the chapters there are specific
[35:29] lessons. The lesson is divided into video information for your convenience. Lectures are also available accelerated, like on YouTube. You can watch them accelerated 100 %, 50%, and not waste a lot of time on it. There is also
[35:43] text information, a kind of summary of what you specifically need to remember. If there should be any additional material, we also provide additional materials. And if you have homework
[35:58] that is included in your training package, here you will have the opportunity to complete your homework, attach it, and the curator will check this homework and give you some specific Recommendations regarding your progress
[36:11] Recommendations regarding your progress in Part 3. So, I'm answering your in Part 3. So, I'm answering your questions and
[36:23] prices, he's asking for a percentage of prices. We have different ones. If you have money, choose the maximum package. If you don't have money, but hang in there,
[36:35] opinion, this is the ideal price-quality ratio. But if you really have no money, you're just like, "last Herbie Sol," take the basics. The knowledge there will already be enough to get involved in this process.
[36:55] Ask questions, colleagues, on the topic of today's discussion.
[37:26] since the stream is recorded and, accordingly, the feeds will be watched. They are, accordingly, the feeds will be watched. They are, of course, interested in the topic.
[37:42] built for elimination. They were in the plus for more than a year, but around New Year's, the bot drained their deposits. Some managed to make money, some again, some in the minus. money, some again, some in the minus. Sirius 735 wrote a project about
[37:57] any averaging. Sirius, but unfortunately, it is fraught with consequences. You can trade on it. You can install a bot and feel pretty good since we're talking about indicators today. There was such a robot at one time.
[38:12] was such a robot at one time. Ylang-Ylang 16, it is still one of the most successful robots in my opinion, so far I probably haven't seen a better one. Well, it's clear that it's one of those available to the public, so to speak. And
[38:27] what was the essence of this robot? We slightly modified this robot for ourselves. At one time, slightly modified this robot for ourselves. At one time, we again created a moving average. I don't remember the period anymore. Guys, it was a long time ago, about ten years ago. We
[38:41] created a moving average, and if the market was above this moving average, we simply withdrew our position with the expectation of returning to this moving average. And it worked, it worked simply
[38:54] brilliantly. At night, we connected our position, then the market turned around and closed our position. It worked for the time being. At one point, one point, all the money was
[39:07] all the money was
[39:22] lost. Unfortunately, it was stupid of us not to withdraw some profit. Therefore, if you are already engaged in the average, you can withdraw it. You should withdraw profit at least once a week, understanding that sooner or later you will lose all your money because this damn averaging also has a different strategy. I used my time with a different strategy now. I'll try to draw it for strategy now. I'll try to draw it for you, if it works out,
[39:40] 14 years ago, a long time ago, at the very beginning. You probably did it in 2009 or 2010. The essence of the robot was as follows: the
[39:56] averages. There was a period of, I think, three if my memory serves me right. Moving average 1. The moving average was built based on the closing of the author's candles. Based on
[40:09] the opening of the candles, a kind of corridor was formed. The price corridor. If, for some reason, for example, in conditions of high volatility, the market went beyond this
[40:23] corridor, here I sold, sold using a grid, but a grid for selling was built. Of course, sooner or later the market returned and reached this point, so I closed the position accordingly. For the time being, everything worked
[40:38] brilliantly. That is, again, the profit was just my dear mother. There was a profitability chart, almost parabolic, growing, but again, my general incompetence at the time, plus a lack of understanding of how the market works, plus A
[40:52] lack of understanding of how the market works, plus A misunderstanding of what averaging is led to a situation where, due to the news, the market shot up like this. There were attempts to average with this bot and sit on the entire deposit, and it was lost somewhere around
[41:06] here at the very top. This is a classic genre. You can't do anything about it. Plus, besides this, unfortunately, I was trading on the Forex market back then, and then I don't know about now, it seems like this is
[41:20] rarely seen anymore. There were so- called cancers. That's why, because of the lyric, there are a huge number of such profitable situations. I traded more than once, and your advantage is that here there was a requote, and here there was a ric,
[41:35] and here there was a ricotta. The market reversed only somewhere around here. You were able to enter a position, that is, unprofitably. Roughly speaking, a huge amount of profit was lost on this, plus a huge amount of profit was lost on
[41:47] spreads. Here, there was a huge demand on the broker. Unfortunately, at that time, there was an abundance of Forex scams and Forex scams, particularly among
[41:59] brokers, and therefore, it was difficult to find an adequate broker that would allow trading using this trading system. I didn't really succeed with strategies using indicators, but using indicators, but
[42:13] I earned a little bit back then with the broker Extabit. She's a Ukrainian broker, but I think they have something there and sports, I don't remember how it all ended.
[42:31] trading robot. You can google it and you'll definitely find it.
[42:46] I see that we don't have any questions on the topic of discussion today. The Alligator indicator is by Bill Williams. Bill Williams' Alligator indicator is
[42:58] largely built again based on moving averages. I have n't really used it myself and, unfortunately, I didn't know anyone who used it. But again, the principle of a trend indicator is embedded in it. I think it will
[43:13] work well in a trend but will work poorly in a sideways market. In
[43:29] determines the trend now or flat? Unfortunately, I haven't seen such indicators. You Unfortunately, I haven't seen such indicators. You can do this using a moving average, that is, set two moving averages, and if the market, well, for example, let's say
[43:43] averages, and if the market, well, for example, let's say for some reason the market goes inside this moving average, it is between them. We kind of assume that it's flat, but this is just an
[43:57] assumption of this kind. Still, we'll have to do this here. Whether you like it or not, you'll have to Still, we'll have to do this here. Whether you like it or not, you'll have to responsibly connect your experience in a different way. I haven't used the axis yet,
[44:10] your experience in a different way. I haven't used the axis yet, but I've heard something about thumb strategies, and I've never heard of them before. I
[44:25] we have top-notch training. You won't find the best training today. We have the You won't find the best training today. We have the coolest training.
[44:45] In the end, I'll answer the question of how best to trade binary options or binary options. You can't earn more than you lose in the
[44:58] long term. You'll lose it. There's not a single person who trades long-term, except for bloggers on YouTube. But bloggers on YouTube have bonus accounts that you and I draw 30 for brokers. Your broker doesn't
[45:13] draw you any, considering there's no way you can make money on this. Unfortunately, as for the Ichimoku indicator, I think you really need to researching it. It won't work to study it in two articles, since I've even come across
[45:28] entire, almost scientific dissertations on the topic of Ichimoku. Ken Ho could also do it, in my opinion. If memory serves me right, I've read several books on this topic. It's a very interesting indicator in terms of what it is, let me check it out. Let me see how it works.
[45:44] All these Ichimoku clouds are quite interesting, but I've never bothered with them myself. interesting, but I've never bothered with them myself. Fibonacci correction also works pretty well. What is Fibonacci
[45:59] in general, and Fibonacci as such, but in my opinion, the Fibonacci retracements I've used all work well. But again, work well. But again, correction to the middle and to 61. But when a
[46:13] trader applies Fibonacci to every candle, this is also overkill. That is, more you look at the picture, the better. I've been making stable money on binary options for a year now, but you're probably the first one
[46:28] I've seen. Well done. Well done. Then you 'll teach the old man the stars. I'll also 'll teach the old man the stars. I'll also be making money on binary options.
[46:42] once? I went on such a spree. I'll go and learn binary options to make a ton of money. I wish you good luck and see you in a I wish you good luck and see you in a week, everyone.


⚡ Saved you 0h 46m reading this? Transcribe any YouTube video for free — no signup needed.