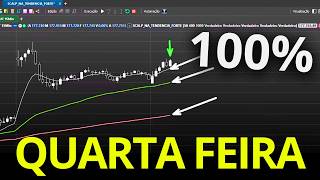

96% Win Rate Strategy Revealed
54sHigh success rate grabs attention and curiosity about a scalping pattern.
▶ Play Clip"The title is accurate: the strategy did achieve 100% on Wednesdays, but it's not 100% overall."
This video presents a scalping strategy for the 15-minute mini-index chart that achieved a 96% success rate in backtests. The strategy uses three exponential moving averages (9, 50, 200) and a specific 10:15 candle to enter trades with a 50-point target and 400-point stop loss. Notably, the strategy performed exceptionally well on Wednesdays, achieving a 100% success rate over 60 trades.
A scalping pattern on a 15-minute chart that works in both uptrends and downtrends, aiming for quick trades with high success rate by entering in the right direction and exiting quickly. Backtest achieved 96% success rate.
Three exponential moving averages: 9-period (white), 50-period (green), and 200-period (red). The strategy operates on the 15-minute chart of the mini-index.
Market must be above all three moving averages. Use the 10:15 candle (opens at 10:15, closes at 10:30). The candle must close at least 1000 points above the day's opening price. Enter buy at the high of the 10:15 candle with a target of 50 points and stop loss of 400 points.
Market must be below all three moving averages. Use the 10:15 candle. The candle must close at least 1000 points below the day's opening price. Enter sell at the low of the 10:15 candle with a target of 50 points and stop loss of 400 points.
Since 2014, the strategy achieved 96% success rate, profit factor of 3.41, 283 trades, and only 10 stop losses over 10+ years.
Tested on each day of the week: Monday (98% success, 50 trades), Tuesday (94.92% success, profit factor 2.33), Wednesday (100% success, 60 trades), Thursday (3 stop losses), Friday (3 stop losses). Wednesday was the best day.
Operating only on Mondays and Wednesdays yields 99% success rate, 110 trades, profit factor 13.63, drawdown 7.92%, and only 1 stop loss.
The scalping strategy using three EMAs and the 10:15 candle shows exceptional performance on Wednesdays with a 100% success rate. Combining Monday and Wednesday trades yields a 99% success rate with minimal drawdown, making it a robust approach for scalping the mini-index.
What are the three moving averages used in this strategy?
Exponential moving averages of 9, 50, and 200 periods.
01:13
What is the time frame of the chart used?
15-minute chart.
00:19
What is the specific candle used for entry signals?
The 10:15 candle (opens at 10:15 AM, closes at 10:30 AM).
03:32
What is the minimum point difference required between the 10:15 candle close and the day's open for a buy entry?
At least 1000 points positive.
02:49
What are the target and stop loss for each trade?
Target: 50 points, Stop loss: 400 points.
04:02
What was the overall success rate of the strategy in backtesting?
96%.
00:32
How many trades were taken in the backtest?
283 trades.
06:32
Which day of the week had a 100% success rate?
Wednesday.
09:11
What is the success rate when trading only on Mondays and Wednesdays?
99%.
10:36
What is the profit factor when trading only on Mondays and Wednesdays?
13.63.
10:36
96% Backtest Success
Demonstrates the strategy's high reliability over a long period.
00:3210-Year Backtest
Shows the strategy's robustness across different market conditions.
06:17100% Wednesday Success
Identifies a specific day with exceptional performance, allowing optimization.
09:11Monday+Wednesday Optimization
Combining best days yields 99% success rate with minimal drawdown.
10:07[00:19] a really cool scalping pattern on a 15-minute chart that works within both uptrends and downtrends. The intention of this strategy is to make quick trades when the market has strong
[00:32] buying or selling pressure, precisely to achieve a high success rate by entering in the right direction and exiting quickly. This strategy achieved 96% in our backtest. I'm going to show you exactly how
[00:46] do some very interesting tests here, testing this strategy day by day. For example, I'll test only on Monday, then I'll test only on Tuesday, then I'll test only on Wednesday, then only on Thursday, and then only on Friday. And
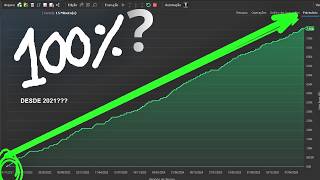
[01:00] what happened on Wednesday is quite interesting. This setup was simply impressive on Wednesday, and I'm going to show you why in this video. With an extremely upward capital curve since 2014, this strategy has been working
[01:13] very well here on the 15-minute chart of the mini-index. To set up this, we'll need three exponential moving averages . Look closely, this white average here is an exponential moving average of nine closing prices. This
[01:28] green average here is an exponential moving average of 50 closing prices. And that red moving average is an exponential moving average of 200 closings. So
[01:41] here on the graph I have an average of 9, an average of 50, and an average of 200. They are all exponential. This setup will operate on both buy and sell positions in
[01:53] the morning on the 15-minute chart of the mini-index. To place a buy order, I need the market to be above these three moving averages. Look, if the market is above these three moving averages, I can
[02:07] place a buy order. But if the market is below those three moving averages, I will place a sell order. And then we'll have buying or selling transactions. In order for me to make a purchase transaction, I have the
[02:22] following conditions. I need to take the 10 and 15 candles and I'm going to use this candle here as a signal candle. This will be the only candlestick I'll use 10 and 15 candlestick pattern will work in various strategies because it has a
[02:36] very good ability to indicate the direction. I need the direction. I need the 10 and 15 candle to be above the three moving averages. In this specific strategy, I don't care about the color of the
[02:49] 10 and 15 candles. I'm not going to worry about that. What I want is for this candle here to close with a positive change of 1000 points compared to the opening price of the day. So, look, I need to click here on the
[03:03] opening price of the day and drag the mouse to the closing price of the 10 and 15 candles. And I need this variation to be a positive variation of at least 1000 points. If this is happening, I have an indication that the market is
[03:19] in a very good upward trend, because the variation of the 500 between 10 and 15 already shows a positive variation of 1000 points in relation to the opening of the day. So, to make it easier to understand, I wrote here, look, to enter a
[03:32] buy position I need to use the 10,15 candle. The 10 and 15 candle is the candle on the 15-minute chart that will open at 10.15 and close at 10. The second condition is that I need this 10 and 15 candle to be above the three moving averages. And the
[03:48] third condition is this: I need this 10 and 15 kendole to close at least 1000 points above the day's opening, because then I'll have confirmation that the market is already starting the day with a
[04:02] these three conditions on the chart, I'll place a buy order at the high of candles 10 and 15 here. I'm going to enter with a target of 50 points and a stop loss of 400 points. This is a scalping setup. The goal of this setup is to take advantage of
[04:18] the strong upward trend in the market right at the start of the day. I'm going to take this 10-15 candle, which is a very strong candle to indicate the trend, and I'm going to enter on the breakout of its high, aiming for a very short target of 50 points,
[04:30] precisely so that I can have a high success rate. Look, he hit the target right here. I'm using a stop loss of 400 points, a target of 50 points, and a stop loss of 400 points. In sales, this setup will work the same way, just in
[04:44] reverse, right? In order for me to execute a sell order, I need the candle to be the 10:15 candle, that is, the candle that will open at 10:15 AM and close at 10:30 AM. And I need this candle to
[04:57] close below the 9-period moving average, below the 50-period moving average, and below the 200-period moving average. It needs to respect these three moving averages. Its closing price needs to be lower, and I need that negative variation relative to the opening price of the day, precisely
[05:11] because I want to enter in favor of the trend, and I want the market to be in a strong trend. So, you see, I'm going to need to compare the closing price of the 10 and 15 candles with the opening price, and I need
[05:24] this variation to be a negative variation of at least 1000 points. In this case, we are seeing a negative variation of -123 points. Okay, then, right? The minimum variation required would be 1000 points. I want
[05:37] this so I can enter a market that's showing a strong trend right at the start of the day. Here, the market is already managing to drop 1000 points right at the start of the day. And since I'm going to enter the sale and I'm going to set a short target, the
[05:49] probability of me hitting the target increases a lot, right? since the market is showing a lot of selling pressure right now . So, here's what I'm going to do: I'm going to place a sell order here at the low to look for
[06:02] manages to break through this low here, it will further confirm that the selling pressure continues. So I'm going to enter a sell position here at the break of the low of this 10.15 candle, with a target of 50 points and a stop loss of 400 points. So that's basically how
[06:17] this setup will work. By doing this, he achieved this capital curve, as we're seeing here, since 2014, with excellent statistics, managing to reach a 96% success rate in backtesting.
[06:32] He achieved a profit factor of 3.41, with 283 trades and a 9.33% chance. Look, these were the operations he performed
[06:44] over time. Several operations, all cataloged here, right? In total, there were 283 operations, right? Here is the chart of the operations. He only experienced a few stop-losses throughout this entire period, starting here in 2014. So we
[06:59] have over 10 years of backtesting. More than 10 years. Over 10 years of backtesting here, this setup has taken 10 stop losses and achieved this capital curve. I want to show you how this setup works on each
[07:13] specific day of the week. So let's change things up here. Disable Tuesday, Wednesday, Thursday, and Friday. I'm going to disable all those days and leave the setup running only on Monday so we can see how it goes. Look, I'm going to execute it here.
[07:33] Mondays since 2014, achieving this capital curve with a 98% success rate, 50 capital curve with a 98% success rate, 50 trades, a profit factor of 6.13, and...
[07:46] let's test it only on Tuesday to see how it goes. Look, on Tuesday you already got a little strange, right? It didn't go very well on Tuesday, even though it turned positive. Let's see how the statistics turned out. The
[08:02] profit margin was good, at 2.33. The accuracy rate is very good, at 94.92%. Let's test it on Wednesday so we can see. Or rather, I'll leave the fourth one for last amazing. So, let's test it out here on Thursday so we can see. Look, I'll
[08:18] test it on Thursday so we can see how the capital curve turned out. On Thursday, the capital curve looked like this . Three stops were made on Thursday. Do you remember I said that since 2014 this setup had suffered 10
[08:32] stop losses? Of those 10 stops, three of them were on Thursday. See here? These are the statistics we have here. Let's go. I'll test it on Friday so we can see. And on Friday we had this
[08:45] capital surge here as well. Three stops were taken here on Friday with these statistics here, look. Okay, let's go. I'll test the setup on Wednesday so we can see how interesting the capital curve is on Wednesday.
[09:11] Just look at the capital curve for this setup. On Wednesday, he has a 100% success rate after 60 trades. That's very interesting. Wednesday is by far the interesting. Wednesday is by far the best day for this setup, according to
[09:24] backtests. Look how interesting. This capital curve is extremely upward trending since 2015. Look how interesting this capital curve is. All the trades were profitable because he didn't take a stop-loss order on
[09:39] Wednesday. Every Wednesday with this setup was profitable. How interesting. Take a look at the operations chart here. Only profitable operations. See this? How
[09:53] interesting. Based on this, it's clear that the best days for this strategy were Monday and Wednesday. Let's see. If I set up this system to operate only on Mondays and Wednesdays, let's see what the
[10:07] Wednesdays, let's see what the statistics look like. Monday and Wednesday. Look at that! operate only on Mondays and Wednesdays, I'll have this capital curve here
[10:23] with only one stop loss. Look at that, very interesting, is n't it? The capital curve is very upward sloping n't it? The capital curve is very upward sloping here. Taking the second and here. Taking the second and fourth ones here. Look, we had a total accuracy of
[10:36] 99% . 99% success rate after 110 . 99% success rate after 110 trades with a profit factor of 13.63 and a drawdown of 7.92. And here is the chart of the operations. He only took
[10:52] one stop, right? Here it is. It's interesting how capitalized this strategy is, operating only on Mondays and Wednesdays, which were by far the best days for this setup. According to the backtest, it's possible to make
[11:08] modifications to the variation here, right? If I modify the variation, I will also get other positive results. I could put a variation of 500 points here, for example, but as it is here, his statistics are very
[11:20] this video, just click the like button and we'll see you in the next one. Receive the channel's various strategies. There are dozens of open-source codes that you can use freely in your profit
[11:32] chart. Enroll today and receive, in addition to various setups, complete training teaching you step-by-step how to create strategies in the Profit [music] Chart editor. And best of all, when you enroll, you get
[11:46] access to our support group, where we share various codes and create several strategies based on your feedback. Do you need to program a setup and don't know how? Through our support service, we
[11:59] create the code for you. Enroll today and get access to all of this right away . [Music] We share setups with 100% open source code. You can request an unlimited number of codes throughout the two
[12:13] months of support. You will learn from scratch how to set up various trading systems and obtain statistics to discover winning strategies. A training program designed to teach traders to be more than just
[12:26] ordinary investors; they should develop new strategies for the new strategies for the stock market.


⚡ Saved you 0h 12m reading this? Transcribe any YouTube video for free — no signup needed.