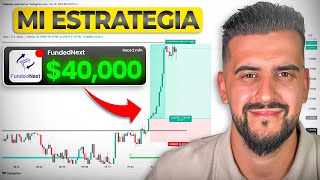

I Made $40K in 30 Days Trading
45sImmediate income claim with proof creates curiosity and aspiration.
▶ Play Clip"Title promises easy $40k in 30 days, but video is mostly self-promotion and basic liquidity concepts with vague trade examples."
The video presents a liquidity-based trading strategy that the creator claims earned over $40,000 in one month using funded accounts. It emphasizes trading only during London and New York sessions, focusing on liquidity pools at highs and lows, and provides two trade examples to illustrate the approach.
The creator states he earned over $40,000 in July using his liquidity-based strategy, trading only 2 hours a day, with withdrawals from Fonden Next and Neoma funding companies.
Benjamin, 27, claims over $1 million in capital raised and $250,000 in total withdrawals, emphasizing transparency in showing payouts.
He mentions withdrawals from Alfa Capital ($96,000) and FTMO ($48,000), reinforcing his track record.
His strategy relies solely on liquidity, not indicators like moving averages. He stresses that liquidity at highs and lows drives price movements.
He trades only during London (9-11 AM Spain) and New York (2-4:30 PM Spain) sessions, avoiding the Asian session due to low liquidity and his sleep schedule.
He advises spending only 2-2.5 hours per session, not 10-15 hours, as it's counterproductive. One session is enough to pass funding phases.
He shows a EUR/USD trade where price broke a low, then reacted upward. He enters at an imbalance with a stop loss of 13 pips and targets a 1:2 ratio.
EUR/USD is the least volatile and least manipulated due to its high liquidity and volume, making it harder to manipulate.
Liquidity is located at previous highs and lows. When price breaks these levels, it often reacts, with 80-90% probability of a reversal or continuation.
Contrary to common belief, breaking a low often leads to upward reaction, not continued fall. This is because stop losses and pending orders cluster at these levels.
He shows a second trade where price broke a low in New York, then he entered at an imbalance, achieving a 1:2 ratio. He emphasizes using market execution for confirmations.
He calculates a total of +3% profit from two trades, which at 2% risk per trade would pass Phase 1 of Neoma (6% target).
The video concludes that trading based on liquidity during specific sessions can be profitable, but emphasizes the need for backtesting and a realistic mindset, as perfect setups don't exist.
What is the core of Benjamin's trading strategy?
Liquidity, specifically at previous highs and lows.
04:04
Which trading sessions does Benjamin recommend?
London (9-11 AM Spain) and New York (2-4:30 PM Spain).
05:27
Why does Benjamin prefer EUR/USD?
It has the highest liquidity and volume, making it less volatile and harder to manipulate.
11:41
What happens when price breaks a low according to Benjamin?
It often reacts upwards because stop losses and pending orders are clustered there.
15:09
What is the recommended risk per trade in Phase 1?
2% risk per trade.
24:48
Liquidity is Key
Challenges common reliance on indicators, emphasizing liquidity as the primary driver.
04:04Breaking the Paradigm
Contradicts traditional belief that breaking a low leads to further decline, offering a contrarian view.
15:09EUR/USD Advantage
Highlights the importance of asset selection based on liquidity and manipulation resistance.
11:41Profit Calculation
Shows how small consistent gains can compound to pass funding phases.
24:32[00:01] trading strategy that has earned me over $40,000 with funding accounts. I'm going to leave the withdrawals from the funding companies here so you can see that this is totally true, and I'm showing you everything in
[00:16] a completely transparent way, like very few do. Incidentally, these withdrawals were made with the companies Fanden Next and Neoma. At FN Next I withdrew more than $1,000 with two accounts of $100,000 and with the
[00:33] Neoma funding company I have withdrawn more than $26,000 with two accounts, each of them of $ 150,000. I've included the payouts here so you can see that this is absolutely
[00:47] true, and that with my liquidity-based trading strategy and trading for liquidity-based trading strategy and trading for only 2 hours a day, I earned over $40,000 in just one month, in July. If you do
[01:01] n't know me or this is the first video you've seen of mine, I'll introduce myself quickly. My name is Benjamin, I'm 27 years old, almost 28 already, by the way, and I've been
[01:13] dedicating my time and energy to over one million dollars in capital raised through funding companies and have already withdrawn a total of over $250,000.
[01:30] Moreover, taking into account these last four withdrawals that I have shown you, the one last four withdrawals that I have shown you, the one from Fanden Nest with more than $3,000 and the one from Fanden Nest with more than $3,000 and the one from Neoma with more than $26,000, making
[01:43] a total of approximately $40,000, I have already withdrawn more than $90,000 in payouts. And again, I'm not making it up like most people do. I'll show you all the payouts, all the funding companies here so you can see that it's
[01:58] true that with my trading strategy I've already earned more than $90,000 funding accounts. I always show all payouts on my Instagram and
[02:11] Telegram, in a completely transparent way. By the way, you can find my Instagram below, which is Pay de algo, where I explain and teach my trading strategy every day through my stories. completely
[02:25] free of charge. So if you're interested or want to know more about my strategy, I invite you to follow me on Instagram. I'm not telling you all this to brag or show off, as they say in Spain. I don't show you these numbers,
[02:38] these funding accounts, and tell you how good I am at bragging or showing off. No, I simply say it and teach it in a completely honest and transparent way, because unfortunately transparency never arrives in this sector of trading
[02:53] , nor has it ever arrived, nor will it ever arrive . That's why, on my YouTube channel and on my Instagram, I always try to be as transparent as possible so that everyone knows that these amounts can very
[03:08] possibly be obtained through trading. Obviously it will take time, it takes the same 7 years of experience that I've had. You need a strategy with backtesting, you need someone to guide you and teach you, especially to save you time because
[03:21] took me. But this is entirely possible. And I'm not just saying that . but I show it to you in a transparent way. I also want to tell you that I have companies, but along the way I've withdrawn from the vast majority of
[03:35] funding companies that we all know. Moreover, my total payout of $96,000 is with a funding company called Alfa Capital, one of the top international companies. You have also withdrawn more than $48,000 from FTMO. Therefore,
[03:52] I can tell you that in all the Funding companies, the vast majority, I have already withdrawn quite a bit of money. With all these results and all these demonstrations, you might ask yourself, what is my trading strategy? No, and explain your
[04:04] amazing, right? Explain a little bit to me. Well, on my YouTube channel you have many examples of my strategy, but to simplify it as much as possible detail and I am actually going to explain several trades that I have taken to
[04:18] achieve all these profits, all these gains, my trading strategy is based solely on liquidity. This word is becoming so fashionable these days, but let me tell you that the vast majority have no
[04:30] idea what they are saying or explaining. And it's not for nothing, results, they don't show withdrawals from funding companies, they don't withdraw anything, they don't teach anything, therefore they don't
[04:42] know how to use this term, liquidity. And my trading strategy is based solely on that, on liquidity; it's the most important thing in the not moving averages, nor the stochastic oscillator, nor anything else. The most important thing
[04:55] in the market is liquidity, which is where all pending market transactions are found and which drives the price, because without money, without liquidity, the price does not move. Therefore, you must be able to fully
[05:10] understand this term and, above all, know where that liquidity is located . So that? Well, to predict those market movements and to be able to enter those market movements to make money, of course. Besides being
[05:27] based on liquidity, my trading strategy is also based on the opening hours of the stock exchanges, the London Stock Exchange and the New York Stock Exchange. There's also the Asian stock market, but in this case, being from Europe, Spain,
[05:40] the Asian stock market isn't convenient for me because I'm asleep. Apart from the Asian session, it usually moves moves sideways in an accumulating way in most cases.
[05:52] bank transactions, no movement, and the interbank algorithm does not have enough liquidity to execute orders. Therefore, the market is usually quite range-bound, so it's not in our best interest. Therefore, my
[06:05] opening of the London Stock Exchange and the New York Stock Exchange, and what those times are. Basically, the London Stock Exchange would be open from 9 am to 11 am Spain time and from 2 pm to 4:30 pm Spain time. If
[06:19] you're from another country, just do a time conversion and it will work out need to trade both sessions, the London session and the New York session. Moreover, when I had a conventional job before I
[06:32] dedicated myself full time to trading, I had to choose a schedule depending on afternoon or night, because I also had night shifts, since I traded the London session or the New York session. And let me tell you, it was more than
[06:45] enough to make money and retire from my job, because I retired from my job after operating just one session. Currently, since I only dedicate myself to trading, I have time and on most occasions, I trade both
[06:58] sessions, since it's only 2 hours in the morning and 2 hours in the afternoon, and it's not difficult for me to analyze the market and, above all, also send it to my students so they know what I'm seeing and where I enter, what I translate,
[07:11] all of that, of course, I teach it to my students, and I have to be on the London session and the New York session. But if you have a regular job or don't have enough time to operate both sessions,
[07:25] suits your schedule, and only operate that session. What I mean by these sessions is that you don't need to spend 15 hours, 10 hours in front of the chart; in fact, it's counterproductive. The best thing is to spend 2 hours
[07:38] in the morning, 2 and a half hours in the afternoon, or just stay for one session, trade one of those two openings and that's it . And believe me, you'll have enough opportunities to pass phase one and phase two in the
[07:51] funding companies. You'll have more than enough opportunities. And now we're going to analyze a trade based on my strategy, which I actually used in these funding accounts I showed you, with which I managed to get that withdrawal of more
[08:05] than $0.000 in July. I want to show you this trade so you can see and understand my strategy, what I base it on, how to allocate liquidity, and also how I take trades, which is something
[08:18] many of you ask me about, right? What login confirmations do I use? Well , I have several. Because? Because sticking with just two or three, well, I think that's Basically because the market price is not always the same,
[08:33] the same patterns do not repeat themselves, especially in low timeframes. Sometimes it will give you a change in structure, sometimes it wo n't; sometimes it will give you some candles that are better than others; sometimes it will give you a bigger boost
[08:46] than others, but ultimately there are always some changes, and if you only stick to specific patterns, especially in low timeframes to catch that trade, you will most likely miss
[08:58] out on a large percentage of trades, which is what happened to me, especially at the beginning when I was getting the idea of the strategy and I expected everything to be perfect, and what happened was that most of the
[09:12] trades slipped through my fingers. Because? Because I was waiting for the perfect stage, the perfect Z to make my entrance. And it must be clear that in trading we rely on percentages, probability, variance and statistics. Obviously,
[09:24] when we enter the market, we don't know what's going to happen. It is our favor because we are analyzing the chart with repetitive patterns on a large number of occasions, and therefore we have a little more variance in
[09:40] know what the price will do. We cannot predict the market because if we could, everyone would make money in the market, and the reality is that they don't. The reality is that more than 90% of
[09:52] Therefore, what needs to be clear is that we shouldn't look for the perfect scenario, the perfect setup, or wait for all the patterns that your favorite mentor has told you about to happen. Because? Because most likely in most
[10:07] moves, in most trades, you will be left out of the market. And I prefer to use a larger stop loss , a stop loss of 7 or 8 pips, rather than a stop loss of 2 or 3 pips and miss
[10:20] out on most trades, because this will only lead to frustration and take too long to reach funding levels, especially in phase one, which requires 8 or 10% depending on the
[10:32] company. Therefore, what I recommend is that you have, of course, a trading plan, something you are studying and something where you are favor, but that you are not too
[10:45] perfect scenario, because the perfect scenario in trading does not exist. This is always changing. There will be times when it will leave you with a scenario, a setup that is more beautiful than another, more appealing than another, and it will turn out badly. I'm sure you've seen on more than
[11:00] one occasion that the setup is perfect. Wow, this setting is perfect. This is the trade of my life. I'm going to earn a million dollars here. And sure that on more than one occasion you've caught a trade that's neither here nor there, as they would
[11:13] say in Spain, that's there, it happens, but just barely, and it's given you a bit of TP. And this is trading. We rely on statistical probability and variance. Therefore, don't be so strict when looking for trades,
[11:26] because most of the time you'll miss out if you don't have a quick mind and aren't willing to take risks. What do we find in this graph? Well, as I was saying, we come across the euro-dollar currency pair. I
[11:41] only trade Eurodollars. Because? Basically because it's the asset with the least volatility and the least manipulation. Because? Well, for a very simple reason: it's the currency pair with the highest
[11:54] transaction volume and the greatest liquidity . Therefore, an asset that has a lot of liquidity within it is more difficult to manipulate. Even so, the market is totally manipulated, but it's the same to manipulate, I don't know, a
[12:07] random cryptocurrency as the euro-dollar currency pair. It is much more difficult to move the euro-dollar market because it is the most liquid currency pair in the world. Therefore, if a person puts 1 million euros into this market,
[12:22] the price will most likely not move or even be noticed. Therefore, it makes him the least manipulable within the all markets, well, in all our lives, because in all
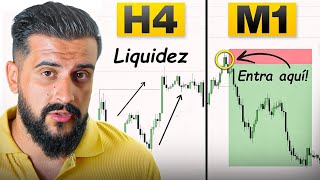
[12:35] areas we are manipulated, but well, that's for another video. What we find here is that in the euro-dollar currency pair, the price has settled a low on the H4 chart. On the daily chart we could also see
[12:48] this pending low, and on the H4 chart we would have this price has settled a low and as I was telling you before, my strategy is based solely on the times and on liquidity. Where is that
[13:03] liquidity located? Something we need to locate before entering any trade, because it is located at every previous low and high , that is, at every high and low of the past there is liquidity. In fact, I recommend that you do
[13:18] backtesting and see that at each high, at each low, of 4 hours or one hour, you will when it clears it, when it breaks a low, breaks a high, in the vast majority of cases, 80-90% of the time, the price tends to
[13:31] reacting? Well, here we have a minimum. The price reaches this low and tends to go upwards. It is not known, of course, whether it will continue to fall or whether it will finally break the highs above. In any case, whether it's a
[13:46] recovery move like this one here or an expansion move to continue upwards and break these highs, this move we're seeing here is more than enough to make money. Keep in mind that the majority of
[13:58] Keep in mind that the majority of my successful trades are around 7, 8, 10, 12 pips, depending on whether there is a lot of volatility in the market. Therefore, a move of 50, 60 pips, 40 pips, 30 pips is more than enough to make
[14:12] money. Because? Because I work with relatively small pips, and if the price moves from 30 to 60 pips, I already get my 1 to 2 ratio, my 1 to 3 ratio where I already take partials, set break even and exit the trade. Therefore,
[14:26] what I am looking for is a very simple pattern to see, a very repetitive pattern. And what is that? Well, this one I 'm showing you. When the price breaks a low or a high, the price is very likely to
[14:39] react, whether it's a 40 pip or 200 pip move, it makes no difference. I'll make money in both 40 and 200 pips because my stop loss is considerably small, therefore, with a short move I'll make money. Once
[14:55] liquidity point and know what the price is likely to do, then what we have to do is wait for the price to give us an upward reaction. Because? Because you've broken a minimum. And you might ask, "Hey, if it's
[15:09] broken a minimum, why are we looking for purchases? It doesn't make sense." Most of the time I've been told that when it breaks a low, the price will high, the price will continue to rise. Well, no, that's not how it is. I know that the
[15:24] vast majority of pseudo-mentors, pseudo-gurus that you see around here on YouTube, on Instagram, will have almost always told you, "No, when the price breaks a low it means it's going to keep falling, no, when the price breaks a
[15:36] high it means it's going to go up." Well, that's not the case. I know this pretty much breaks your entire paradigm of the market, of your trading, right? Hey, how can this be a lie if this is the BC of the market? Well, I hate to be the
[15:50] of the reasons why you keep losing money in trading and why you're not profitable: because you follow the vast majority of sheep and the vast majority of pseudo-mentors, pseudo-gurus who tell you they know how to make money,
[16:04] n't make money with courses, with signals on a broker, and that guy doesn't even know how to trade. He's telling you something very repetitive that's been said for a long time, for years and decades, that hey, you
[16:21] read trading books, right? When it breaks a low, we'll look for a sale. Well, that guy is just a parrot; he repeats what was said profitable, and he doesn't make money from trading. Therefore, no, this is not
[16:34] true. When the price breaks a low, in the vast majority of cases, and with a high probability, it tends to react upwards. Because? Because that's , where all the pending orders are: stop, loss, take
[16:47] profits, sell stops, buy stops, buy limits, sell limits, all those pending orders. Where are they located? Well, mostly in highs and lows. And it's very logical, which I'm sure many of you have
[16:59] never thought about. Why is the vast majority of liquidity found Basically because there's no other way to protect yourself in the market than by placing your stop loss at a high or a low. In other words, if you're looking for a sell, you're going to
[17:12] place your stop loss at the furthest high, or at the last high, or at the high that created the momentum. If you buy, where are you going to place your stop loss? Well, in the last low that has created that great momentum. You're going to
[17:24] that created that impulse, and you're going to place your stop loss there pending. Well, all the liquidity, all the money is found at those maximum and minimum points. That's why the market, when it liquidates those liquidity points, minimums and
[17:39] maximums, tends to react in the vast majority of cases. Of course, there are fall or continues to rise when it breaks a low or high , but the vast majority of the time this pattern is constantly repeated. And I'm not the one telling you this,
[17:54] my results tell you so. $40,000 in July with funding companies, $ 67,000 and change in January, my best trading month. And I'm not . You can go to my Instagram, give it a like, and you'll find the first
[18:09] pinned post where I show you all the payouts with FTMO, with Fanderness, with Alfa Capital, with companies that everyone knows. And yes, in January I made $67,000 and this month, this July, last month, $
[18:22] 40,000. Therefore, in those two months alone I have already accumulated $000. strategy works because otherwise, well, I would n't make 1 euro, I wouldn't make a penny, tests aren't enough for you, I encourage you to backtest. Check out the
[18:37] backtesting, and see what I mean. Listen, the price, every time it breaks a high or low on the H1 or H4 timescale, tends to react most of the time. Obviously not 100%, but 70%, 80%, 90% yes. Okay, so this
[18:51] results, I'm seeing with my own eyes that this strategy works. Well, when you have that clear, simply backtest, backtest, backtest, trial And there you will gain the experience and knowledge that I have with this strategy
[19:06] that works, as you can see. But let's continue with the example so you can see how I took that trade. Let's continue with the example I was giving you, I'm getting confused, okay? I always try to make everything as clear as possible, and of course, so that
[19:19] all these quantities I show you are totally possible. Well, we see that the price settles this point and let me tell you something, it entered both sessions in asleep or working during either of those sessions, don't worry , you had
[19:33] surgery in both sessions. We see that the price is not settling at this minimum that midst of London's reopening, which we are seeing here, this structural change would be leaving us with. He hasn't done it yet . If it does not, then it would be
[19:47] invalidated. As you can see here, it's invalidated. Here we already have a change in structure and we see that the price has created different imbalances. As you can see, we have this one and we have this one here, okay? We also have
[19:59] it, of course. And the million-dollar question, hey Benjamin, when there are so many imbalances, what do I do? Well, dude, I'm not a fortune teller or a magician, okay? So, I don't know which one will mitigate. What you can do is, hm, take a chance, so to speak, and
[20:11] to get the best entry, you would put your order here. And if you don't want to take risks, that is, if you want to enter the trade 100%, then place your trade at the first imbalance. Obviously this will mean that your take profit, your SL will be a
[20:24] lower ratio, a much lower stop loss to take profit ratio, but that's how it is. If you want to risk placing your entry here, what can happen is not touch this imbalance. Therefore, this is according to
[20:38] you. I personally don't usually take risks . I usually go into the first one I considerable ratio. If I see that I have to set a stop-loss of 200 pips, then I don't enter, that's all is remediable. Here you are seeing 13 pips. Okay, I'd go down, maybe set my stop loss
[20:53] have a smaller stop loss, and go for my 1:2 ratio. Okay? As you can see, this time the price will touch this imbalance, and this will the price does not touch the imbalance you want, because there are several, it will leave you
[21:08] earlier. If you're willing to miss out on 70% of the trades, here. Obviously your ratio will be much better. As you can see, here I would be same position and in the other I would only be giving a one to two, but there is also
[21:23] the possibility that you will be left out. This would be our entrance. It plays see. I'm seeing through the camera that it doesn't look right. And here we would be getting our 1 to 2 on the first entry, the first trade
[21:35] seeing here. Very easy to see, but not only that, but this pattern is becoming more frequent. And now let's go for the second trade he made that same day. He gave the New York session, in case you were asleep in one and didn't catch it, he gave it to you
[21:50] in both sessions, London and New York. What happened in New York? minimum available here, this minimum that we have here. And in the New York session, the price went straight to clearing that low, as we can
[22:04] see here. Boom, liquidate that minimum. So here we could have missed the first stop loss, and I'll explain why. Who are we going to M1? One reason we stop is because it breaks first with a wick, and this is usually not a good sign.
[22:19] Anyway, here we see how it breaks with body and we would have this imbalance available. Here we could place our pending order and here we would eat this stop-loss. There is a way in which I usually avoid entering
[22:34] pending orders in imbalances. And it is for this reason, the reason why imbalances and the price does not respect it at all, it simply touches it and falls apart. once, in fact I'm sure it's happened to you, whether with imbalance or
[22:48] pending order and the price, boom, has passed it. For this I have a tip, a piece of n't explain here out of respect for my students, which is that to avoid all these types of pending order situations , I normally execute at
[23:02] market. So that? Well, to see some extra confirmations that I look for in that imbalance once the price touches it. In other words, when I mark the imbalance, the price touches here and does some things, some entry confirmations to
[23:14] then look for buys. I don't usually go in for the earring, I usually go in for the market. So that? Well, to look for those extra confirmations, but I'm sorry, but I can't explain it here out of respect for the students in the
[23:26] explain everything. What do we have here? Well, the price breaks this pending order, then we would have an SL. We marked it here. I'm completely indifferent. Here we would have a minus 1. M. completely indifferent. Up here
[23:39] we would have a +2, therefore we have a positive +S1. And here we go. The structural change would therefore be here. And what we can do here is switch between time periods. Let's see what he's doing. Okay, here we see how the price
[23:52] changes its structure on the M5 timescale, leaving an imbalance, and here we could place our pending order. We covered ourselves below looking for S12. It's very close to our SL. Let's stretch this out. The thing is, since it's a scheduled
[24:06] entry is within the session, but as the volatility because there is less volume, okay? That's why the price moves more in a range, more erratically, okay? Anyway, you can let your order
[24:19] run. I do it on many occasions and here it would give us a ratio of 1 to 2. Asian range, and what it basically tells you is that the Asian session has started. Therefore, here we would have another plus do which would take us
[24:32] this way plus do in London, -1 in New York and +2 in New York. a total of +3 York and +2 in New York. a total of +3 + 4 and a loss of -1 = a + 3% profit. If you put this at a 2% risk in phase 1, then it would be leaving you with, eh, 6%,
[24:48] and practically with Neoma in this case it only asks for that in phase 1 6% and phase 2 6%, so you would have passed phase 1 at a 2% risk per trade, which I recommend especially in phase one. Well , here's how I
[25:02] operate, my trading strategy, which of course you can find much more content and many more videos on my YouTube channel, so you can learn much more. This video comes to an end. I have already explained with two examples how I have
[25:15] managed to obtain all these withdrawals, more than $290,000 funding companies with funded accounts and specifically $40,000 in this month of July, that is, last month. All of this
[25:27] trading strategy, because I have achieved it based solely on liquidity, on those maximum and minimum points, on those times, trading only 2 hours which as I say, you can keep with just one session. When I had my
[25:40] job, that's what I did, and it's more than possible, really. Believe in trading, believe in doing things right. Everything takes time, but believe and see this as a goal, look at the withdrawals, these payouts, not as an
[25:55] ego boost of "how good I am," right? Look at this, this normal guy from Seville, 27 years old, who worked as a security guard 12 hours a day, has achieved this, he has withdrawn $0,000 in a month of July, in any month at the company
[26:08] of Fondeó. Why not me? If I have the same tools as him, conversely, when I started trading, there were n't as many videos, there wasn't as much teaching, and there wasn't a mentor like me. Joking aside, I hope you
[26:21] lot, and that it motivated you, of course. And by the way, below in the social media links, my Instagram, and you also get a 30% discount on all funding accounts. Just enter the code Belique exactly as it
[26:36] sounds and you'll get a 30% discount on all products, on all accounts. That's all. I hope this video has been helpful, that you enjoyed it, and that you really go for it with trading—it's definitely possible! See you
[26:48] trading—it's definitely possible! See you in the next video.
⚡ Saved you 0h 26m reading this? Transcribe any YouTube video for free — no signup needed.