
Druckenmiller's Election Strategy Backtested
60sA legendary trader's advice is validated with 40 years of data, making it both educational and intriguing.
▶ Play Clip"The title promises three strategies and delivers them, but the constant Telegram promotion and lack of in-depth backtest data make it feel like a teaser for paid content."
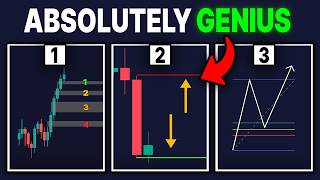
This video presents three trading strategies: a presidential election cycle strategy, a daily candle open/close strategy with liquidity and fair value gaps, and a Fibonacci-based golden zone strategy. The creator backtests the first strategy and provides detailed entry, stop loss, and take profit rules for the others.
The creator claims all three strategies have been backtested and were profitable in the long term, promising viewers will learn them by the end of the video.
Druckenmiller's advice: buy the market 2 years before the general election and sell on the election day. The creator tests this advice.
Statistics show years 1 and 2 of a president's term have lower returns, while the end of the term has higher returns. From 1980 to now, investing 2 years before the election and selling on election day yielded positive returns every time, except 2004 where it broke even.
Following this strategy, 2026 is the buy year and 2028 is the sell year. The creator implies this is favorable given recent market conditions.
This strategy uses one daily candle. If bullish, buy below the market open; if bearish, sell above the market open.
On the daily timeframe, mark the open and close of the candle. Then switch to a 30-minute timeframe. If the daily candle is green (bullish), wait for price to go beneath the open (sell-side liquidity).
Liquidity is described as a fakeout where price breaks a low and immediately reverses, which is a bullish sign.
Price must break the previous high (break of structure) with a strong close above it, not just a wick, to confirm bullish momentum.
A fair value gap is a three-candle formation created by a rapid price move, leaving an imbalance. It's marked from the first candle's top wick to the third candle's lower wick.
Wait for price to retrace to the fair value gap, enter there, set take profit at the market close, and stop loss below the recent low.
A losing trade occurs when the candle only wicks above the high but doesn't close above it, showing weakness. The body must close above the break of structure.
Set Fibonacci tool values to 0, 0.706, 0.618, 1, and 0.79. This creates three levels that act as a 'golden zone' where price is likely to reverse.
Mark from the low to the high of an uptrend to get the golden zone. Pair it with a fair value gap for a better entry. Set take profit at highs and stop loss below the zone.
Mark from the high to the low of a downtrend. Look for a bearish fair value gap within the golden zone. Enter short, set stop loss above highs, take profit at lows.
The creator suggests combining all three strategies for an 'ultimate strategy' and promotes a free Telegram channel with additional strategies.
The video provides three distinct trading strategies with clear rules, but heavily promotes a Telegram channel, which may detract from the educational value. The presidential cycle strategy is historically backtested, while the others rely on technical analysis concepts like liquidity and fair value gaps.
What is the presidential cycle strategy as described by Stanley Druckenmiller?
Buy the market 2 years before the general election and sell on the general election day.
00:45
What was the only negative return period in the backtest of the presidential cycle strategy from 1980 to now?
The presidential election of 2004, where you basically broke even.
01:49
What is liquidity in the context of this video?
A fakeout where price breaks a low and immediately reverses, which is a bullish sign.
03:24
What is a fair value gap?
A three-candle formation created by a rapid price move, marked from the first candle's top wick to the third candle's lower wick.
04:05
What is the key requirement for a valid break of structure?
The candle body must close above the break of structure, not just wick above it.
05:42
What Fibonacci values are used to create the golden zone?
0, 0.706, 0.618, 1, and 0.79.
06:09
Presidential cycle strategy backtested positive every time
This is a strong statistical claim that could influence long-term investment decisions.
01:49Liquidity explained as a fakeout
Provides a simple, actionable definition of a complex concept.
03:24Fair value gap definition
A clear, teachable explanation of a key technical analysis pattern.
04:05Importance of candle close in break of structure
Highlights a common mistake that can turn a winning trade into a losing one.
05:42[00:02] strategies that I've backtested over and over and every single month that I tested them all three ended up being profitable in the long term. And by the end of this video, you too will know all the strategies and will be able to take
[00:15] calculated trades just like this one and make a TON OF MONEY. OH, BY THE WAY, I JUST FOUND A STRATEGY that performs extremely well and I just posted it in my Telegram. This strategy absolutely prints. My Telegram is
[00:31] completely free to join, tons of value, and you can find some amazing strategies in there. I literally find profitable strategies for a living. You want to comments. I'll see you in there. >> My first boss in Pittsburgh in 1976
[00:45] said, "Stanley, the way you time the political cycle is you buy the market 2 years before the general election and then you sell it on the general election good in the election year." >> That was Stanley Druckenmiller, one of
[00:58] the best-performing traders to ever live. And he just gave us potentially one of the best strategies you could possibly hear. But, I'm not going to exactly take his word for it, so I'm going to test it. Let's try. First, I'm
[01:10] returns are for each year of the presidential cycle. The statistics surprisingly backed up what Stanley was saying. Years one and two of the president being elected generally had lower returns, while the end of the term
[01:23] generally had higher returns. Then I went to the chart and this is where things started to become very, very eye-opening. I marked every single year from 1980 till now and marked 2 years before the president actually got
[01:36] elected. Then I marked every single year the president actually got elected. If you simply followed the strategy of investing 2 years before the president got elected, then selling when the president actually got elected, you
[01:49] would have made positive returns every single time. Let me repeat that. Positive returns every single time. Out of the 40 years, the only time we had negative returns was the presidential election of 2004, where you basically
[02:04] broke even. That's insane. What's even crazier is if you decided to follow this advice, 2026 is the year you would be buying, and 2028 is the year you would sell. And if you haven't been living under a rock for the past 5 months, you
[02:18] following this strategy for this presidential term, let's just say you'd be pretty well off. On to the next. To start us off with the second strategy, we're going to explain one of my personal favorites. It involves just one
[02:32] candle, and this candle can completely change your life. Let me explain. If you're overall bullish, you want to buy below the market open. If you're overall bearish, you want to sell above the market open. Let me show you. Go on
[02:45] I'll leave a link in my description. First, go to the daily time frame. In this example, we are overall bullish with this candle, since it's green. Go to that candle, mark the open and the close of this candle. Next, go to a
[02:59] smaller time frame. For this example, we are using the 30-minute time frame. This green line marks the daily candle's open that we marked before. This red line marks the daily candle's close that we also marked before. Since the daily
[03:12] candle was green and overall bullish, we only want to enter if price goes beneath thinking, "Why would we buy if price is going down?" The answer, liquidity.
[03:24] Liquidity is a pretty advanced topic, but to make it as simple as I possibly can without going too in-depth, it's basically just a fakeout, where price breaks a low and immediately reverses afterwards. Which, if this ever happens,
[03:36] it's an extremely bullish sign. So, going back to our example, we want some type of sell-side liquidity that goes slightly beneath the market open, does a fake, and starts heading in the opposite direction. Check. Next, we want price to
[03:50] show some sign of respect or bullish momentum by breaking the previous high or in other words a break of structure. To do this, just find the latest high, put a line here, price must break this high before doing anything else. Check.
[04:05] Usually while doing this, price will create a fair value gap. A fair value gap is simply just when a chart moves up or down an insane amount creating a huge gap. Price moved up so fast here that it didn't give sellers enough time to
[04:19] counter act the movement. Naturally, sellers will want to retest this zone again. A fair value gap will always be a three candle formation. You can mark a fair value gap by marking the first candle's top wick before the big move to
[04:32] the third candle's lower wick after the big move. This zone is the fair value gap itself. Congratulations, you now know what a fair value gap is. So, going back to our example, usually when price breaks this previous high, while doing
[04:46] so, it'll leave behind a fair value gap. Check. Wait for price to retrace back to the fair value gap, enter here, set your take profit at the market close, and set your stop loss below this recent low. And just like that, we got a winning
[05:01] trade. And you now know a super profitable strategy. But, there's a We got our break of structure, and we got a fair value gap. The perfect trade. You set your stop loss, you set your take profit just like we did before, you
[05:14] enter the trade ecstatic and are ready for an easy winning trade. But then, this happens. So, what happened? Why was this a losing trade? You see, this trader did have the right idea, but there's something very wrong [music]
[05:27] sweep, price does a break of structure just like it should, but there's still something wrong. When doing this break, the candle doesn't close above the high. It just wicks above it and comes back down, which shows weakness. What we are
[05:42] looking for is something like this. When breaking this break of structure, price breaks through it strong. But the key thing we're looking for is the body of the candle closes above the break of structure like this. Now that we have a
[05:56] break of structure that not only broke, but broke strongly through it and closed above the break of structure, we can now enter at a fair value gap like normal and now we have a winning trade. On to the next. This one tool can predict
[06:09] exactly where price is going to reverse and it's pretty damn good at it. First, grab your Fibonacci tool, go to the settings, change the values to 0, 0.706, settings, change the values to 0, 0.706, 0.618, 1 and 0.79. This will give you
[06:24] three main levels that will look like this. These levels are what's called probability to reverse. But we're going to add a little bit more to it to make
[06:38] our edge even greater. First, find an uptrend, mark from the low of the uptrend to the high of the uptrend. Once this is done, we now have our golden zone where price is most likely to reverse. But we can make this trade even
[06:52] better. What I like to do is pair this with a fair value gap. So here we have a bullish fair value gap, but not only that, it's paired exactly within our golden zone. Wait for price to come to our golden zone and within the fair
[07:05] value gap, enter here, set your take profits at the highs, set your stop loss below the golden zone. Boom, easy winning trade. But you also need to know what to do if the chart is going downward. This time price is going
[07:17] downwards. So we'll look for shorts. Mark from the high of the move to the low of the move. This will give us our golden zone. Ideally, we want to see a bearish fair value gap within our golden zone, which is exactly what we have
[07:30] here. Wait for price to come back up, enter into our golden zone, but not only that, enter into our bearish fair value gap. Enter short trade, set your stop loss above the highs, set your take profit at the lows, and we got yet
[07:43] another winning trade. You can combine all three of these and make the ultimate strategy. What's even crazier is all this value looks like an absolute pebble compared to what I just shared in my Telegram. I share all the highest
[07:57] performing strategies in there. Whenever I find one, I test it, and if it's profitable, I share it. It's completely free to join. If you want to check it pinned comments. I'll see you in there.
[08:10] Thanks for watching, and I'll see you guys next time.
⚡ Saved you 0h 08m reading this? Transcribe any YouTube video for free — no signup needed.



![BEST MACD Trading Strategy [86% Win Rate]](https://img.youtube.com/vi/rf_EQvubKlk/mqdefault.jpg)