
The 4 Fibonacci Levels You Must Know
52sIt instantly reveals the exact Fibonacci retracement levels traders use, making it a high-save educational snippet.
▶ Play Clip"Delivers exactly what the title promises—a clear, step-by-step guide to both continuation and reversal setups, with minimal fluff."
This video provides a comprehensive guide to using Fibonacci retracement for both trend continuation and reversal trading. It covers market structure fundamentals, key retracement levels, and step-by-step strategies with real chart examples. The presenter also explains the psychology behind these setups and offers practical tips for improving accuracy.
Prices move in waves of impulses and pullbacks, driven by buyer-seller dynamics. Strong buying leads to higher prices, while strong selling pushes prices down.
The most important Fibonacci levels are 38.2%, 50%, 61.8%, and 78.6%. These levels act as potential support or resistance areas.
Small pullbacks (38.2%-50%) indicate strong trends, while deep pullbacks (50%-78.6%) suggest weakness or potential reversal. Corrections not reaching 38.2% are not valid pullbacks.
For continuation, place a buy limit at the 78.6% level, stop loss below the swing low, and target the swing high. This offers a 1:3 risk-to-reward ratio.
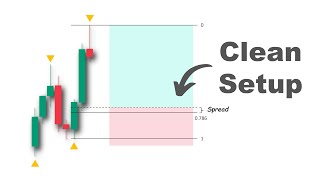
Adjust limit orders slightly below the 78.6% level to account for spread. Also, check higher timeframe structure to ensure there is room for the price to move.
Reversal strategy combines a major structural level, a double top/bottom pattern, and Fibonacci retracement. Entry at 61.8% retracement, stop below swing low, target next structure level.
For a valid double top, the second test's wick must touch the box drawn from the first test's close to wick, and the body must not close above it.
What are the most important Fibonacci retracement levels to watch?
38.2%, 50%, 61.8%, and 78.6%
02:57
What does a small pullback vs. a deep pullback indicate in a trending market?
A small pullback (38.2%–50%) signals a strong trend, while a deep pullback (50%–78.6%) indicates weakness or a possible reversal.
03:48
What is the entry, stop loss, and target for the trend continuation setup?
Place a buy limit order at the 78.6% level, stop loss below the swing low, and target the swing high.
05:13
Why is the 78.6% continuation setup considered to have a good risk-to-reward ratio?
Because it offers a risk-to-reward ratio of approximately 1:3, meaning a winning trade can cover losses from three losing trades.
05:53
How should you adjust your limit order to account for the spread?
Place the order slightly below the 78.6% level to account for the spread.
07:47
What three key concepts are combined in the reversal strategy?
A major level of structure, a double top or double bottom pattern, and the Fibonacci retracement tool.
11:02
How do you confirm a valid double top pattern?
Draw a box from the highest candle close to the wick of the first test; the second test's wick must touch the box, and the body must not close above it.
11:47
What is the entry, stop loss, and target for the reversal setup?
Place a buy order at the 61.8% retracement level, with a stop loss below the swing low and a target at the next structure level on the higher timeframe.
13:26
Small vs. Deep Pullbacks
Distinguishing pullback depth helps traders gauge trend strength and potential reversals.
03:48Continuation Setup at 78.6%
Provides a clear, rule-based entry with a favorable risk-to-reward ratio.
05:13Spread Adjustment
Practical tip to ensure limit orders trigger despite spread, improving execution accuracy.
07:47Higher Timeframe Context
Checking higher timeframes prevents entering trades against major structural zones.
08:14Double Top Confirmation Rule
Provides a clear, objective method to validate double top/bottom patterns.
11:47[00:02] how to take both continuation and reversal trades using the Fibonacci retracement tool. These strategies have proven to be profitable for many traders over the years in Forex, crypto, and gold. We'll walk you through how to set
[00:14] up your trades and where to exit step by step. We'll also explain the psychology behind these strategies and why they work so you can back test them and trade them confidently. So, if this is something that interests you, please hit
[00:28] the like button to show your support and subscribe if you're new. Before explaining the strategies, let's start with some fundamentals of market structure. Whether you're trading forex, crypto, stocks, or any other
[00:41] financial market, you'll notice that prices tend to move in waves of impulses and pullbacks. This wavelike behavior is driven by the actions and psychology of market participants.
[00:53] When there is strong buying interest but relatively few sellers, the sellers can raise prices because they have more control. Eventually, the price reaches a level where more sellers are willing to enter the market. If the imbalance
[01:05] between buyers and sellers continues, this pattern repeats and prices continue to rise in cycles. On the contrary, when there is strong selling interest but limited buying pressure, sellers are forced to accept lower prices in order
[01:19] to find buyers. This creates a downward push in the market. After each significant drop, there might be a small pullback as some buyers enter or sellers take profits. But as long as selling pressure remains dominant, this cycle of
[01:33] lower highs and lower lows continues, defining the structure of a downtrend. When the strength of buyers and sellers are almost equal, the market enters a state of equilibrium, often referred to as a ranging or sideways
[01:47] market. In this phase, there is no clear directional momentum. Buyers are not resistance and sellers are not strong enough to push the price below support. In a choppy market, prices move up and down quickly with no clear trend.
[02:04] Buyers and sellers keep taking control back and forth, so it's hard to tell who is winning. The market looks messy with lots of sudden moves and fake breakouts. This makes it risky to trade because the price can change direction at any
[02:18] it's better to stay out and wait for direction. Now, let's go back to trending markets. Knowing when a pullback ends and a new strong move begins can help you make good profits.
[02:31] This is because you can catch the best chances to buy or sell. And this is where Fibonacci retracement levels help us. The Fibonacci concept suggests that if we break down the start and end of a price wave, certain levels have a higher
[02:44] potential to cause a reversal. These levels are horizontal lines drawn on a price chart to show possible areas of rejection. The most important levels to watch are 38.2%, 50%,
[02:57] 61.8%, and 78.6%. These levels can help you find 78.6%. These levels can help you find good points to enter a trade. Now, let's get back to the previous example. We've identified the most recent impulsive
[03:09] move and are now waiting for a pullback to enter a long position at a better price. Grab the Fibonacci retracement tool, apply it at the start of the impulsive move from the bottom of the wick and drag it to the top of the move.
[03:22] You'll then see the retracement levels appear on the right. When the price pulls back to these levels, they can act as support and potentially reject the price, allowing the uptrend to continue. Here you can see that the price hit the
[03:36] 618 level and continued pushing higher. Now here's an important point. Pullbacks come in many shapes and sizes. There are two main types, small and deep
[03:48] pullbacks. A small pullback, typically between the 38.2% and 50% retracement levels, signals a strong trending market. On the other hand, a deep pullback, usually falling between the 50% level
[04:02] and a previous support area, indicates weakness in the trend and may suggest a possible reversal or slowdown in momentum. If the correction does not reach at least the 38.2% level, it is not considered a valid pullback. We
[04:17] should treat the entire movement as a single leg. These were some of the basic concepts about market movement and retracement levels. Now, let's move on to the advanced part where we'll show you how to use Fibonacci levels to enter
[04:30] trades. Usually, we combine retracement levels with price action in two main ways. The first is trend continuation setups and the second is reversal strategies. Let's begin with the first one, the trend continuation setup using
[04:45] retracement levels. This is a very simple strategy, but it's also very powerful in theory. It's based on the 786 retracement level, and it works best with pairs that often make deep pullbacks like gold. Since
[04:59] this is a trend continuation setup, you should only use it when the market direction is clear on your chosen time frame. So, in the first step, simply identify the trend and the latest impulsive move. Apply the retracement
[05:13] tool from the start of the move to its end. Set a buy limit order exactly at end. Set a buy limit order exactly at the 786 level. Place your stop loss just below the swing low and target the swing high. Now, why does this work? And
[05:27] what's the psychology behind this trade? Since we're in an uptrend, there's a higher probability that the price will retest the swing high rather than break below the swing low. If it does break below the swing
[05:40] trend reversal. So, we anticipate a retest of the swing high before any potential trend reversal occurs. Even if the overall trend is starting to shift, this setup offers a
[05:53] risk-to-reward ratio of approximately 1:3. The good sides of this trading strategy are that it's based on a strong idea. It's easy to use. It gives a good risk-to-reward ratio, and it follows the trend. But the downside is that in
[06:08] strong trending markets with small pullbacks, you might miss many trade chances. Now, let's look at this setup step by step on a real chart. But before trading platform that lets you trade forex, crypto, and stocks all in one
[06:22] place, you should check out Simple FX. Simple FX is one of the top rated trading platforms on Trustpilot, and offers many great services. Its userfriendly interface works great on the web, desktop, and phone. With over
[06:37] 1,000 assets, great customer service, and high leverage up to 1,000, it offers many unique features. On top of that, Simple FX offers a deposit bonus of up to $5,000 depending on how much you deposit. If that sounds good to you,
[06:53] check the link in the description. Here on the Euro Dollar 1 hour chart, the latest price action suggests a smooth downtrend with multiple downward movements. So, we take the retracement tool and apply it from the start of the
[07:05] swing to the end. Now, sometimes you ask, smart risk, how do you know that this is the end of the impulsive move? The answer is that we don't know and we don't need to. If the price continues pushing downward, we simply adjust the
[07:20] retracement tool to fit the latest price action. Now, let's execute the trade. Simply set a sell limit order exactly at the 786 retracement level. If the market pulls back deeply enough to engage enough liquidity, we'll
[07:35] have a high probability entry. A winning trade with 1 to three risk-to-reward can cover the loss from three losing trades. However, there are two important things to consider if you want to improve the
[07:47] accuracy of this setup. The first is the spread. Price often reacts to the 786 level within a pip. So, if you want your order to be triggered, you should place it slightly below this level to account for the
[08:01] spread. The second thing you need to consider is the higher time frame market structure. Before placing any trades, always ask yourself where has the price come from and how much room does it have to continue before reaching an important
[08:14] zone in front of it. Let's go back to our example with it. Let's go back to our example with Euro Dollar. If we zoom out to the 4hour time frame, we can clearly see that there is a higher time frame important
[08:26] level ahead of the current price. And since there's still a lot of space before the price reaches that zone, it makes sense to look for short positions on the lower time frames. But now imagine a different situation.
[08:40] Suppose the price had already touched or mitigated a higher time frame demand zone. In that case, we wouldn't want to enter a short trade without some kind of confirmation. Why? Because once a higher time frame support has been tapped, the
[08:54] market can easily reverse direction and ignore any smaller supply areas on lower time frames. I hope that part was clear, but if not, let's walk through another example. Here on the gold 1 hour time frame, we can
[09:08] see bullish momentum with recent upward movements. This is our most recent impulsive move. As long as the market stays above the swing low, we're still in an uptrend. We want to go long aligned with the market
[09:22] direction. But we can't enter the trade right now because the price is too high. at a better price. But again before placing any trade, let's take a step back and check the higher time frame to get the full
[09:37] picture. Now switching to the 4hour chart, we notice that currently we are at a higher time frame important zone. Just look at how many times these levels acted as support and resistance previously.
[09:51] The conflict between lower time frame bullish momentum and tapping into a higher time frame important zone will cause the price to consolidate for a buyers and sellers. But still, if we had stuck to
[10:05] our trade setup and set a buy limit at the 786, we would have had a winning trade. But if you want more conservative trading opportunities, always wait for setups where nothing important is in front of the price.
[10:19] So, as you can see, combining Fibonacci retracement with market structure from both lower and higher time frames can give you a very strong and reliable strategy. Let's move on to the next part of this video, the reversal trading
[10:34] setup using Fibonacci retracement levels. But before we continue, take a moment and comment below on what topics you want us to cover in future videos. We always check your suggestions and they help us decide what to create next.
[10:48] tricky because we're placing trades against the dominant trend. But the benefit of reversal setups is that they can offer a very high riskto-reward ratio. The strategy I'm about to show
[11:02] you is a combination of three key concepts. A major level of structure, a double top or double bottom pattern, and the Fibonacci retracement tool. Now, let me show you what a major level of market structure actually is. A
[11:16] where the price has been rejected multiple times, acted as both support and resistance, and was recently respected. These levels are powerful because they often cause strong price reactions. When the price reaches such a
[11:31] level, it creates a great opportunity for a potential reversal trade. The second element is the double top or double bottom pattern. This is a classic M-shaped or W-shaped pattern used by many price action traders. But
[11:47] we use a simple rule to confirm whether the pattern is valid. In the case of a double top, draw a box from the highest candle close to the wick of the first test. For the second test to be valid, its wick must at least touch the box and
[12:00] the candle body must not close above it. The same concept applies to the double bottom. Now let me show you how this reversal trading strategy actually works. We use two time frames in this setup. First, we analyze the higher time
[12:17] and find a major level where the price might get rejected. Imagine if this line chart is our higher time frame price movements. We can see that the market was in a downtrend, but after reaching a certain
[12:30] level, it failed to create a new lower low showing a loss of bearish momentum. Then the price broke through a key supply zone which means demand has taken control. Now we identify this major level of structure that was previously
[12:45] respected as both support and resistance. Since the market has reacted to this level multiple times in the past, there's a high chance it could reject the price again if tested. So this area would make our optimal trading
[12:58] zone to go long. Also, there's still a lot of space for the price to move up before hitting the next supply zone, which makes this a strong setup. The next step is to wait for the price to reach this structural level.
[13:11] Once that happens, we zoom into a lower time frame to find a precise entry. On the lower time frame, we look for a valid double bottom to confirm the reversal. When the price breaks above the neckline and completes the pattern,
[13:26] we take our Fibonacci retracement tool, measure from the start of the move to the top and place a buy order right at the 61.8% level. We put our stop loss just below the swing low and our target will be the next structure level on the
[13:40] higher time frame. Now, let's look at a real example on gold. On the 4hour chart, we can see that the price recently broke above a key supply zone.
[13:52] That means demand is now in control. So we are only looking for buying opportunities. We can also identify a major level of market structure that has recently been respected as support and resistance multiple times. If the market
[14:07] pulls back to this key level, it becomes a perfect spot to look for long trades. Once the price taps into this area, we zoom into the 1 hour chart to look for entries. Now on the 1 hour chart we can see much
[14:22] more detail. After hitting this level it has formed a double bottom showing a strong rejection. After that the neckline breaks which confirms the reversal. But if we enter the trade
[14:35] right away our stop loss would be too big. So instead we wait for a pullback to get a better entry price. We apply the Fibonacci retracement tool from the low to the high of the move and place our buy order at the 61.8%
[14:51] the swing low. Once the trade is active, we manage our position carefully. You can close half of the trade once the price reaches twice your risk, making the trade risk-free. Then you can close the
[15:07] remaining part when the price reaches the higher time frame supply zone. did, please smash the like button to
[15:20] support the channel, and I'll see you in the next episode.
⚡ Saved you 0h 15m reading this? Transcribe any YouTube video for free — no signup needed.