
AI Summary
The video teaches a price-action trading strategy based on two timeframes, key levels, and momentum confirmation. The instructor walks through three live trade examples — a reversal, a continuation, and a retest reversal — explaining when to enter, where to place stops, and how to target 1:3 risk-to-reward profits.
Chapters
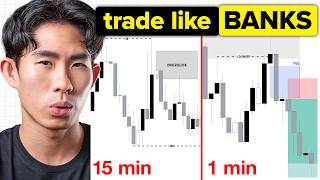
Use the 1-hour (or 50-minute) timeframe for market structure and the 15-minute for entries. You can adapt to 5-minute for scalping or 1-hour for swing trading. A clear uptrend shows higher highs and higher lows.
Do not enter when price is in the middle of nowhere. Wait for price to retrace to a key support/resistance level to add confluence and confirmation.
If you have a full-time job, set a TradingView alert at the level. When price arrives, you can open your phone and assess the setup.
Large bullish candles show strong buying pressure. A small red candle at resistance tells you buyer momentum is fading and sellers may take over.
On the 15-minute timeframe, wait for a strong bearish signal — such as a clean close below a minor level or a break of structure — before entering a sell.
You will not win every trade, but taking setups systematically and being patient at key levels raises your chances of becoming consistently profitable.
A long wick candle at a level means price may retest before reversing. Wait for a clean close below the level or a clear rejection before entering.
After a higher high, wait for price to form a higher low. Beginners often buy too early when price retests the previous higher low, but price can break it.
Three long-wick candles on the 15-minute chart at support indicate sellers are losing momentum and price may reverse upward.
Don't enter during the push. Wait for price to retrace to the broken resistance/support and show a rejection candle before entering a trade.
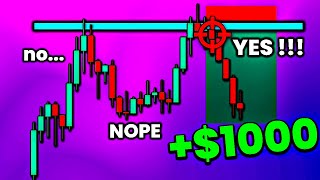
The trader aims for 1:3 risk-to-reward, placing the take profit at three times the stop-loss distance. This is applied consistently across setups.
Consistent profitability comes from waiting for price to reach key levels and confirming momentum shifts with candlestick signals, not from chasing every move. The three examples demonstrate the same repeatable framework across different market conditions.
Mentioned in this Video
Tutorial Checklist
Study Flashcards (7)
What two timeframes are used as the base of this strategy?
easy
Click to reveal answer
What two timeframes are used as the base of this strategy?
The 1-hour (or 50-minute) timeframe for market structure and the 15-minute timeframe for entries.
00:02
What does a small red candle at a resistance level signal?
medium
Click to reveal answer
What does a small red candle at a resistance level signal?
It signals that buyer momentum is fading and sellers may take over the market.
02:14
Why did the trader skip the first close below the key level in the first example?
medium
Click to reveal answer
Why did the trader skip the first close below the key level in the first example?
Because the candle had a long wick, showing price could still retest the level before reversing.
04:04
What must price form before entering a continuation buy after a higher high?
medium
Click to reveal answer
What must price form before entering a continuation buy after a higher high?
A higher low.
05:25
What do three long-wick candles on the 15-minute timeframe at support indicate?
hard
Click to reveal answer
What do three long-wick candles on the 15-minute timeframe at support indicate?
They indicate a momentum shift — sellers are losing momentum and price may reverse upward.
07:24
Where should the stop-loss be placed in the continuation buy example?
easy
Click to reveal answer
Where should the stop-loss be placed in the continuation buy example?
Below the swing low.
07:53
What risk-to-reward ratio does the trader aim for?
easy
Click to reveal answer
What risk-to-reward ratio does the trader aim for?
1:3 risk-to-reward, with take profit at three times the stop-loss distance.
11:09
💡 Key Takeaways
Small red candle at resistance
It provides a clear, visual cue that buying pressure is fading right at a key level — a simple but powerful price-action technique.
02:14Consistency over individual wins
Reframes trading success as a long-term statistical process, not a single winning trade.
03:38Trading is all about being patient
A direct, quotable reminder that waiting for the right setup is a core edge for retail traders.
06:30Three long wicks signal momentum shift
A concrete, repeatable confirmation pattern that can be applied on any timeframe.
07:24Markets move in push-retrace phases
Explains why price never moves in a straight line and why waiting for retracements is structurally sound.
09:10Full Transcript
[00:02] that you can use to get high win rate threads these are the signs that i personally look out for when entering into a trade let's look at the first sign right now we are only using two time frames for this strategy the one
[00:15] hour time frame and the 15 minute i'm gonna be using the 15 minute time frame for my entries for your entry you can use whatever time frame you want be it five minutes for scalping or one hour for swing trading this strategy will
[00:29] work so right now you can see that the market structure is bullish and price is in a clear up trend if you can't identify that go to the 50 minute time frame and look to see what price is doing and as you can see price is just
[00:41] creating your higher highs higher lows higher highs and higher lows price just making your push phase retrace push phase retrace so we are in a clear uptrend price has just made a higher high which show us that that is a
[00:55] lot of buying pressure but it went back down and break below and now it's all the way down here this may show us that there's a little bit of selling pressure and price might reverse and head back down but we do not want to enter for or
[01:09] sell here yet we want to wait for the market to come back to a key level so that we can have additional confluence additional confirmation most traders that are not patient enough to wait for price to come back to a key level so
[01:22] they end up taking trades when price is in the middle of nowhere just like this and then they end up getting stopped out what we are gonna do is that we're gonna be patient and wait it doesn't really matter if price reverse at this key
[01:34] level and go down and we miss that entry it doesn't matter to us we are still up to this key level and then go back down like this this is a very good strategy to use if you are working at your full-time job or you do not have
[01:47] can do is that you can just play alert at this level and then when price eventually get up to that level tradingview will send you like alerts telling you that price is at that level then you can open up your phone and
[02:00] want you to look at the candlesticks that is approaching this major right here let me just zoom in for you guys to see and you can see price is making big candlesticks big candlesticks big candlesticks means that that is a
[02:14] lot of momentum a lot of buying pressure pushing the price up so we might be expecting price to break through this key level rights but look at this next candle it's actually a small red candle at this resistance level this tells us
[02:28] that the buyer's momentum is gone it's getting lesser and lesser and the sellers are gonna take over the market now what we can do is that we can go which is the 50 minute timeframe to look for our entries now we're going to wait
[02:42] for the market to give us like a very strong bearish confirmation that tell us that price is going to reverse and head back down so right here and price at this key level we still wait to see what price is doing and as you can see price
[02:54] just broke out of like this little level that price has failed to break past multiple times so just broke out of this level and this show us that price might much just see like this candlestick close below this level right here and it
[03:09] just broke structure so at this point of time this is when we can enter for the cell position you can pretty much see right here there is a lot of buying pressure and a lot of momentum pushing the price up but as price approaches
[03:22] this key resistance level it starts to lose momentum and at this point of time market and the sellers are pushing the price back down so that is how you can get a very nice reversal so i'll just enter for sell position right here are
[03:38] we going to win this trade every single time for sure hell no but the more often you take these trades in a systematic way and be patient enough to wait for price to come back up to these key levels and wait for
[03:51] confirmation the higher the chance that you are gonna become a consistently profitable trader in the long run actually you know what i still would have entered right here because like it didn't give us like a very nice close
[04:04] below this key level you can see it gave us like a long wig candle which show us that employees can still continue to go up and re-test this level before going back down so we still wait and see what price showed us and as you can see price
[04:16] did exactly what i thought it will it went back up to re-test this level once height you can see this high is lower than this one so at this point of time we are still waiting for price to break through this little support level that
[04:29] we have drawn right here and give us like a very nice close and then that is still wait and as you can see price consolidate and finally it's like finally breaking past but this still gave us a week right and
[04:41] still not going to be entering right here i want to look for like a very nice close below like a nice red body below this key support level then our enter so is giving us that right here this is when we can enter or sell right here and
[04:56] support level that we have drawn right here and then place my take profit at way down here two times my stop-loss and let's look at how this trade payout okay price went down and smashed our
[05:11] heading back up now let's look at the second sign and as you can see once again price is in the uptrend creating a higher highs and higher lows higher right now prices just gave us a higher high because this high is higher than
[05:25] this high right here but where is the higher low there is no higher low this to make a new higher low you'll make like higher low like this and then go this low so right now price has not gave
[05:38] us a higher low yet so we do not want to enter here remember we don't enter when when price retrace and then go back up then this is a nicer entry than comparing to entering right here right so right now we are waiting for price to
[05:52] retrace to create your structure and then that is when we can enter for the right now we are just waiting for price to create a higher low before entering for the trade and as you can see price has come back down to re-test the
[06:05] previous higher low which is right here this is the previous higher low what does this mean does this mean that price is going to go up now no most beginner traders they get in right here immediately when price come back down to
[06:18] this like we test this last higher low so they get in a buy right here like oh my god we gotta enter right here before you miss the opportunity but i want you to remember that price can easily still break past this level and go back up
[06:30] like this all right it can easily still do that just because price break past this level does not mean that it's going to reverse and head back down so we do and wait remember trading is all about being patient and as you can see price
[06:45] just broke through this support level like what we expected it to do prices broke through this last higher low but we still do not enter here yet boys now we are going to look for some sort of momentum shift which tell us that this
[06:58] little retracement is going to be done and price is going to then that is when we can enter for the trade so what i will do is that i'll go to the 15 minute time frame scale down to the 15 minute time frame to look for
[07:11] my entries so now that we are in a 15 minute time frame we saw that there is multiple like long week candles being formed right here one two three three long weekenders that is like a very good sign because this tell us that this is
[07:24] the momentum shift that we are looking for the sellers are losing momentum if the price wanted to go down even further it would just continue making big red candle sticks just heading back down but no price gave us a long week candle not
[07:37] one not two but three long weekenders which told us that price might be reversing price might be rejecting this support level and heading back up let's before we make a decision we can see like price gave us a long weak candle
[07:53] once again at this point of time this is when our enter for the trade because looking for price has literally just went from like a huge retracement to shifting the momentum and now it's in the buyer's market so we can enter for a
[08:06] buy right here place my stop-loss below this swing low right here and i'll place my take profit at three times my stop loss right here three times my stop loss out as you can see like price went back up and
[08:18] smash our take profit right there boys i'm pretty sure right here we smashed our take profit and we have closed that trade guys this is a very important concept that you must understand you can see previously yeah just been going down
[08:30] a lot of selling pressure pushing the price down but at this point of time it starts giving us the momentum shift you start making long week candles just rejecting this key support level and then it gave us a big green candle and
[08:43] it gets bigger and bigger which show us that the buying pressure are back into this market the buyers are in control of the market now so price is going to go to the moon now so the first example was a reversal trade the second example was
[08:56] a continuation trade now for the third one we're gonna be looking at another reversal trade i want you to remember that the market will never ever go down in a straight line he has to go down retrace go down retrace go down retrace
[09:10] because price is making your push phase exhaustion push phase exhaustion and then push phase right now price has just been going down and showing us there is a lot of selling pressure but at this point of time look at what the
[09:23] candlesticks are showing us it starts giving us like small tiny little candlesticks like this which tell us that maybe the sellers are tired right and price is losing momentum so right now price has to retrace to create your
[09:37] new lower high before going down even further but we cannot end up for a buy here yet we want to look for a few more candlesticks that tell us that price is actually losing momentum so at this point of time i'll scale down to the 50
[09:50] when you scroll down to the 15-minute timeframe you can pretty much just see that like price is just losing strength and it does not have the strength to go down even further which means that price
[10:03] is going to start like pulling back before going down even further and right consolidating and we can draw like a little resistance aerial and we still wait to see what price does next and you can see probably just continue
[10:16] consolidating consolidating so at this point of time you can see price has finally broke past this little resistance area but remember we do not want to enter when price is pushing we want to enter when price retrace coming
[10:28] down to this resistance level we test it before going back up then that is when we can enter for our sniper entry so right now let's see like if price come back down to re-test it and you can see right now price come back down to retest
[10:41] this little resistance area so now we can enter for a buy position right here actually no i'll wait for the next candlestick with next candlestick somewhere right around here i see too long with kendall rejecting this little
[10:55] going to go back up so i can enter for a buy right here place my stop box below this little resistance level which now acts as your support level and now i'll place my take profit at three times my stop loss which is all the way up here
[11:09] and remember guys like it doesn't matter if you go for three times your stop-loss really matter i just like to go for three times right i always aim to get one to three risk to reward let's take a look at the result of this trade you can
[11:23] see price went up and smashed our take profit three trades and we have just won helpful make sure you smash that like button and hit on that subscribe button so whatever that i just showed you just now was all pure price action so if you
[11:38] want to learn more about price action trading you can check out this video right here click on it bro click on it bro welcome to the tribe and remember you're just one straight away