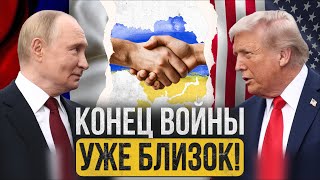

Peace Could Trigger Market Boom?
60sCombines a controversial geopolitical topic with a bold market prediction, sparking curiosity and debate.
▶ Play Clip"Delivers on the promise of top 5 stocks and market analysis, but includes significant personal opinion and portfolio details."
The video analyzes the likelihood of a peace agreement between Russia and Ukraine from a financial markets perspective, using chart analysis and cyclical patterns. The presenter predicts that the current negative market phase is ending and that a peace deal could lead to significant stock market gains, particularly in Russian stocks. He also shares his personal portfolio adjustments and highlights five stocks that could benefit from a positive scenario.
The presenter claims to have predicted past events using cyclical analysis and mathematical relationships on charts.
Crises in 1998, 2008, 2014, and 2022 led to ruble weakening, but the presenter argues this pattern is ending.
The market is transitioning from maximum pessimism (war) to optimism (peace), signaling a positive shift.
Both dollar-ruble and dollar-hryvnia charts indicate the end of the downward trend, with hryvnia expected to strengthen.
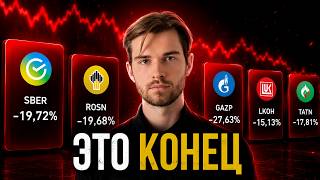
A peace agreement would reduce geopolitical risks, ease sanctions, and boost energy, financial, and transportation sectors.
The presenter moved 50% of his bond portfolio (which yielded 50% return) into Russian stocks, betting on the end of the war.
Key quote: 'What matters is not whether I am right or wrong, but how much I earn when I am right and how much I lose when I am wrong.'
Historically, when the Central Bank key rate declines, the stock market rises. Current high rate suggests future cuts and market growth.
The presenter expects Russian stocks to outperform altcoins, which he views as risky and likely to decline.
Moscow Exchange shows an uptrend impulse with a zigzag correction; target price around 350-400 rubles per share.
VTB is extremely undervalued with a potential 400% increase from current levels, based on chart structure and fundamental factors.
Aeroflot's price is in accumulation with a broken trend line; Gazprom is near global support and expected to rise in the medium term.
Rosneft could benefit from rising oil prices. The presenter holds 15 stocks diversified across sectors, with 30% in energy.
The presenter is optimistic about a peace agreement and its positive impact on Russian stocks, having already shifted his portfolio accordingly. He emphasizes diversification and long-term passive income through dividend stocks.
What historical crises does the presenter mention that led to ruble weakening?
1998, 2008, 2014, and 2022.
01:46
What is the presenter's key quote on risk management?
What matters is not whether I am right or wrong, but how much I earn when I am right and how much I lose when I am wrong.
08:03
What percentage of his bond portfolio did the presenter move into stocks?
50%.
06:32
What is the target price range for Moscow Exchange shares according to the presenter?
350-400 rubles per share.
13:28
What is the minimum potential increase for VTB Bank shares from current levels?
Approximately 400%.
15:10
What sectors does the presenter expect to benefit from a peace agreement?
Energy, financials, and transportation.
05:49
What pattern does the presenter identify on the Moscow Exchange chart?
A five-wave impulse followed by a zigzag correction.
12:05
What does the presenter say about altcoins compared to Russian stocks?
He expects Russian stocks to outperform altcoins, which he views as risky and likely to decline.
10:15
Pendulum Shift
Key insight that the market is transitioning from maximum pessimism to optimism, signaling a potential trend reversal.
02:59Risk Management Quote
Powerful quote emphasizing the importance of risk-reward ratio over prediction accuracy.
08:03Russian Stocks vs Altcoins
Bold claim that Russian stocks may outperform altcoins, reflecting a contrarian view.
10:15VTB Undervaluation
Identifies a stock with 400% minimum potential, highlighting extreme undervaluation.
13:57Portfolio Shift
Demonstrates real portfolio action based on analysis, adding credibility.
06:32[00:08] Sergey. This is the Ekigai Canal. And today on our agenda is a possible peace agreement that could happen in the near future. Peace agreement between
[00:20] Russia and Ukraine. At least, I really hope so. But we will still look at the likelihood of this scenario coming true from the point of view of charts, since charts can provide us with a lot of
[00:33] information. Let me remind you that we have already predicted a large number of positive and negative events using the charts. And this is done through the analysis of cyclicity, through certain mathematical relationships.
[00:46] That is, it is possible to do this. And at the end of this video, I'll show you the top five stocks you can buy if the positive scenario comes to fruition. Let's get started together. President Trump recently held separate meetings with Putin and
[01:01] Zelensky. Both meetings were fruitful and constructive. And as a result, Zelensky expressed his readiness for direct negotiations with Putin. Of course, there are no concrete decisions yet, but there is clear progress on the path to peace. A
[01:15] certain dialogue is being built, and now the whole world is waiting to see what will happen next, since Trump wants to hold a trilateral meeting of the presidents. I am, of course, far from politics. I don't like her at all. I
[01:29] look at all of this from a financial markets perspective, how it will impact the financial markets and what the chart says about peace coming soon. So let's move on to the graph and I'll express my point of view.
[01:46] We are all accustomed to seeing how crises regularly occur in the CIS market. For example, there was a crisis in 1998, in 2008, in 2014 and in 2022. All these
[01:59] negative events led to a strong weakening of the ruble. Then we will also weakening of the ruble. Then we will also look at the hryvnia chart, and the looking at the past, think that such a periodicity of negative events
[02:13] will repeat itself. That is, we will see the same thing further. That is, there will be crises, there will be some negative events. And it's understandable that, for example, few investors are considering the Russian market, because
[02:28] investors are very concerned that something like this could happen again. But still, I analyze cyclicality, I analyze certain structures on the chart. certain mathematical relationships. And I want to say that
[02:43] such a period of crisis cannot continue forever . And such a period of crises certain phase that will soon end. The pendulum will inevitably swing from the side of maximum pessimism to the side of maximum optimism.
[02:59] The maximum pessimism now is expressed by war, and the only thing worse than that could be some kind of nuclear war. But if a nuclear war breaks out, we will nuclear war breaks out, we will
[03:12] consider strictly the transition of the pendulum from the side of maximum pessimism to the side of maximum optimism. I assume that this negative market phase is either already over or will end soon. That is,
[03:27] will end soon. That is, . Perhaps, for some time, as I marked on the chart, we will move within the range, of course, with new highs. That is,
[03:39] the ruble will still weaken by a certain percentage , but not as much as before. And ultimately we may is, the dollar-ruble chart will move within a range from level to
[03:52] level and, in essence, remain in one place, like the currencies of many other countries. I won't outline specific price movement scenarios with clear targets, as that's more of a topic for a separate video. Let me just say that, judging by the market
[04:06] picture, I see that we are in the final market phase of this downward negative trend. The same is true for the dollar-hryvnia chart. That is, we see a negative situation, upward impulses on this currency
[04:20] pair, which were moments of crisis in the country's history. And, accordingly, we have now realized a certain mathematical potential. That is, we have reached, yes, here the golden section 0618, passed 62% of the distance of
[04:35] one wave and realized the potential of this range, which was located in this place. This is the most likely target for the fifth wave that I have marked here. And after the fifth wave, the so-called correction of a
[04:49] higher degree or a full-fledged change in trend occurs, as I marked it on the chart. The decline in the dollar-hryvnia currency pair indicates a positive situation in the country. That is, since the most likely growth target has been achieved, I
[05:05] expect with a higher probability the onset of a positive situation and, as a result, the strengthening of the hryvnia. We have analyzed the global picture using the charts of these currency pairs. As a consequence, a peace agreement could lead to the
[05:20] strengthening of these currencies, that is, to the strengthening of the ruble, the hryvnia, and the currencies of neighboring countries. But what interests us most is the stock market. Of course, the
[05:32] peace agreement will have a very positive impact on the Russian stock market, as geopolitical risks will decrease and the sanctions regime will gradually ease. In particular, shares of companies in sectors such as
[05:49] energy, financials, and transportation may rise due to the lifting of sanctions and an improvement in the current situation. We'll look at shares of similar companies a little later.
[06:01] But I want to note that this effect will be largely long-term. This means that sanctions, of course, will not be lifted immediately; investors will be cautious, and therefore, it will take some time for this
[06:16] positive effect to be consolidated if a peace agreement is signed may be some impulses in the short term, but I still expect the effect in the last year, I informed you that I had assembled a portfolio of federal
[06:32] loan bonds because the conditions for purchasing them were the best at that time. And at the current moment, the bond portfolio has already brought me approximately 50% return, even a little more, in dollar terms. And recently I took 50% of these
[06:48] bonds and transferred them into shares. That is, my Russian stock market portfolio has changed a little. And now, as you can see, I have 46% of this capital allocated to the Russian stock market in shares and 53% in
[07:03] bonds. That is, I am gradually focusing on stocks, since I see great growth potential here. Previously, it was the growth potential in bonds, now it is the growth potential in Russian stocks. Let me remind you that investing in stocks
[07:18] during a war is precisely a bet on the end of the war. That is why I am showing you my actions, that is, that I am focusing on ending the war. I believe in it. And I don’t just believe, I analyze and, based on certain
[07:33] probabilities, determine whether this can happen in the near future or not. But I left another 50% of the bond in case of a negative scenario. That is, if the presidents do not reach an agreement now, then the shares
[07:47] will probably fall for some time, and this will allow me to buy them at better prices. That is, I will lower my average purchase prices. We, as traders and investors, must be prepared for all the most likely market
[08:03] scenarios. And the main thing is not what we predict, but what actions we take based on our predictions. Let me remind you of a very important quote. What matters is not whether I am right or wrong, but how much I earn when I am right and
[08:17] how much I lose when I am wrong. This quote expresses the essence of risk management. So, now let's talk about the short-term and medium-term perspective, that is, let 's look at the local picture. On the left I opened the chart of the
[08:32] Central Bank's key rate, and on the right I opened the shares of the rather popular company Sberbank. First, I want to mark a horizontal line at this location and at this location to the left. We see how the key rate rose for some time and
[08:47] key rate rose for some time and then began to decline. During the rise in the key rate, our market fell. It was 2008. And during the fall of the key rate, our stock market grew. I will mark another line in
[09:01] this place at another maximum on the key rate. And I will do the same on the chart of Sberbank shares. Once again we see an increase in the key rate. The price here remained in a range for some time, and then adjusted slightly. And
[09:16] when our key rate began to decline, the stock market began to grow. The same thing happened in this place in the third example. That is, I mark a vertical line here and a vertical line here. Here we had a sharp
[09:31] rise in the key rate and an equally sharp decline. And what we saw on the Sberbank chart was a sharp price drop and then a sharp recovery. Now we are again at a certain maximum for the key rate, and I
[09:47] expect a further reduction. It is possible, of course, that this period will drag on a little. Let's say we see another increase and only then a sharp decline. But in the near future, I expect a reduction in the key rate in any case
[10:01] , and this, of course, is a positive picture for the stock market. These are positive conditions. Considering all the charts I showed you, and also the fact that there is still a possibility of peace
[10:15] in the near future in the negotiations, the Russian stock market has quite good growth prospects. And personally, I expect to see returns here that are higher than those of altcoins. This is not a joke. Altcoins are looking pretty
[10:30] bad right now. And clearly the Altison will not be what many expect. Some individual altcoins are growing, which, in principle, have already grown, and 90% of altcoins will eventually decline. Therefore, the prospects here are much more reliable than
[10:45] altcoins. And I also expect the profitability to be higher than that of altcoins. And if the ruble continues to strengthen, then we will receive a much higher return when investing in Russian shares in dollars . We will now move on to an analysis of the top five
[11:00] stocks that could show quite large growth if peace comes. But before that, I want to make this disclaimer. This, of course, is my entire
[11:12] vision of the market and my actions. You can agree with them or disagree, it makes the comments like some kind of armchair will not grow, that the Russian market will not grow, I don’t care about all of this. If
[11:25] I listened to every armchair expert, I would n’t make money in the market. Therefore, you do n’t even have to write something like that. But still, I will be interested to read your opinion regarding the world. Do you expect peace to come in the near
[11:38] future or not? You can share your opinion in the comments. So, the first company we will look at is in the financial sector. These are shares of the Moscow Exchange company. In a positive scenario, that is, if
[11:51] will gradually begin to enter the Russian market . In this regard, the growth of trading volume will increase, and, of course, this will have a positive impact of course, this will have a positive impact on this company. This is if we talk
[12:05] about any fundamental reasons. What does the graph tell us? Here, after a correction of a higher degree in this place, we see the formation of a five-wave impulse. That is, this is clearly an uptrend structure. After which
[12:20] we had a downward correction. Of course, it's not that deep yet. Fibonacci correction levels here, we see that the price has reached the first golden ratio of 0.382, that is, it has corrected the previous upward impulse by 38%.
[12:36] On a graphical scale, it has not yet done this, and therefore some potential for a fall is still present here within the framework of this downward correction. But after this correction, I expect continued growth. That is, the
[12:48] current picture, namely the upward momentum and the downward zigzag correction, indicates a positive situation in the medium or long term. That is, after the formation of this correction, whatever it may
[13:01] be, the upward movement will continue. And in a positive scenario, fully formed here, that is, a zigzag correction will form, and the price will continue its upward movement. You can focus on the
[13:14] drawn through these highs. If we break this trend line, the likelihood of an increase will increase. Let's find the minimum goal. I'll flip find the minimum goal. I'll flip the levels and mark level 1618 here. The
[13:28] first growth target is around 350-400 rubles. per share. The correction has not yet formed, that is, we do not know whether this correction has formed impossible to determine exact targets. Once the correction is fully formed and there is
[13:42] concrete confirmation of it, then it will be possible to give several specific, precise goals. For now, let's focus on this value. About 350-400 rubles. for shares of this company. There is another extremely undervalued company in the financial
[13:57] sector. These are shares of VTB Bank. Many investors who, yes, invest in the Russian market, do not like the shares of this company. Well, personally, I see extreme undervaluation here, judging by fundamental factors, and an extremely
[14:10] good structure, which indicates a change in trend in the global perspective. sanctions and certain restrictions will be lifted , and, of course, this will have a positive impact on the company in question. And as for the market structure,
[14:25] here we see the structure of a downward trend, the structure of a zigzag that has already formed, most likely. First, wave C of this zigzag has traveled 62% of the distance of wave A. And second, wave C is a so-
[14:40] structure of gradual narrowing of the downtrend. And the fifth wave, that is, this wave of the final diagonal, has traveled 78-79% of the distance of wave three. That is, this is the most likely place for a rebound,
[14:56] for the price to rise and for the trend to change. If we consider the minimum potential of this structure, it is located the same as on the Moscow Exchange, in the region of 400 rubles. per share, which is an increase of
[15:10] approximately 400% from the current level. And this is the minimum potential. We may still see some decline in the short term, but I'm . And in the long term, I currently see a
[15:24] positive situation. Let me remind you that fundamental factors are also subject to fifth final wave of a bull market, fundamental factors are maximally positive. Conversely, in the final third wave of a bear market,
[15:37] let's say, like here, on wave C, the fundamental factors are very bad and Fundamental factors can also help us identify the current market phase and current market structure, which would help us determine the most
[15:51] profitable entry point. And personally, I see this as the very best point. And I'm primarily interested in the cyclicality, and not in what comes after it. The implementation of a positive scenario and the lifting of sanctions will also impact the shares of
[16:06] Aeroflot, a transport company. But here, if you look purely at the chart, the price is within the range, within a certain accumulation. And it is quite possible that the price will eventually rise from this accumulation
[16:20] . If we look at the situation more locally, then I can mark a trend line for this zigzag, for the beginning of this zigzag and the end of the wave without a zigzag, which is a triangle. And we see that this trend line has already been
[16:33] broken. That is, this is a positive factor for the price. And I'll quickly go over the shares of energy companies. The first company we will look at is called Gazprom. Again, many investors do not welcome the shares of this
[16:48] company, but nevertheless, if a positive scenario is realized, that is, if peace comes, the shares of this company may, indeed, grow, at least in the medium term. If we look at the chart, we see that
[17:02] the price is within a certain range in the area of the global support area. And here I expect to see something like this . That is, a, growth in the medium term, then another correction and a further
[17:16] exit from this range upwards. And the last company we'll look at is growth oil. And this company can also benefit from rising oil prices. But I already told you that I expect
[17:30] oil prices to rise in the long term. Therefore, the shares of this company are also warn you that your portfolio should not consist solely of shares of these companies. Be sure to diversify wisely across
[17:44] economic sectors. Let's say I currently have about 15 stocks in my portfolio, and they are distributed across sectors, meaning I am diversifying. My largest volume is in the energy sector, approximately 30%. And my focus is mainly
[17:58] not on making a profit in the medium term, but on the long term. That is, I try to take my portfolio of dividend stocks so that my passive income gradually increases and I can reinvest this passive income
[18:11] back into assets to increase it even more. In this video, I simply listed the stocks you can buy, but you can find more detailed asset analyses with specific scenarios in the Telegram channel, the link
[18:25] to which is in the description. Friends, if you found this video helpful, please give it a like, leave a comment in support, and . I wish everyone all the best, profit, and victory.
[18:39] best, profit, and victory. I love you all and bye to everyone.
⚡ Saved you 0h 18m reading this? Transcribe any YouTube video for free — no signup needed.