
Why Your Stop Loss Hits When It Shouldn't
45sRelatable frustration of being stopped out despite a perfect setup hooks traders and beginners alike.
▶ Play Clip"Title accurately promises a solution for stop-loss frustration using Heikin Ashi and MACD, and the video delivers exactly that."
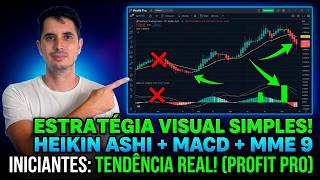
This video explains why traders often get stopped out despite thinking their analysis was correct, and introduces a strategy using Heikin Ashi candles, a 9-period exponential moving average, and the MACD indicator to improve trade accuracy. The presenters, Lis and Ricardo, demonstrate how to set up these indicators on a 10-minute timeframe and provide entry and exit rules for both long and short trades.
Heikin Ashi means 'middle bar' in Japanese. It averages price movements to create a cleaner chart, filtering out noise from normal candlesticks.
The strategy adds a 9-period exponential moving average (EMA) as a directional filter and the MACD to confirm momentum.
If price is above the 9 EMA, only consider buying; if below, only consider selling.
MACD compares two moving averages. When the MACD line is above the signal line, buying pressure is present; below indicates selling pressure. Histogram bars show momentum strength.
For a buy: green Heikin Ashi candle closes above the 9 EMA, and MACD crosses upward.
For a sell: red Heikin Ashi candle closes below the 9 EMA, and MACD crosses downward.
Place stop loss at the low of the first red candle after entry (for buys) or at the high of the first green candle (for sells).
Use a risk-reward ratio like 2:1 or 3:1. Example: risking 800 points to gain 1600 points.
No strategy works 100% of the time. Risk management is crucial; never risk more than you can afford to lose.
The Heikin Ashi + EMA + MACD strategy provides a clean trend reading and momentum confirmation, but traders must always apply proper risk management and test strategies in a simulator first.
What does 'Heikin Ashi' mean in Japanese?
Middle bar or middle leg.
00:48
What is the purpose of the 9-period exponential moving average in this strategy?
It acts as a directional filter: if price is above, only consider buying; if below, only consider selling.
01:45
What does the MACD indicator compare?
It compares two moving averages to show whether the movement has strength or is losing momentum.
02:44
What are the two conditions for a buy entry signal?
Green Heikin Ashi candle closes above the 9 EMA, and MACD crosses upward.
04:54
Where should the stop loss be placed for a buy trade?
At the low of the first red candle after entry.
06:03
What risk-reward ratio does the presenter suggest as an example?
2:1 (e.g., risking 800 points to gain 1600 points).
06:33
True or False: The strategy works 100% of the time.
False. No indicator or strategy works 100% of the time.
10:36
Heikin Ashi Definition
Explains the core concept of Heikin Ashi as a noise-reducing chart type.
00:48EMA as Directional Filter
Simplifies trading decisions by restricting direction based on price relative to EMA.
01:45MACD as Lie Detector
Describes MACD as a momentum confirmation tool to avoid false breakouts.
02:44Stop Loss Placement Rule
Provides a clear, objective rule for stop loss placement based on the first opposing candle.
06:03No Magic Indicator
Emphasizes the importance of risk management over any strategy.
10:36[00:03] to open your manual. I am Lis. And I am Ricardo. And man, I looked at the graph, it was all right, perfect pattern. My strategy is like this: Oh, beautiful. So I went there, full of confidence. Two minutes later, stop.
[00:19] Yeah, but you know, who does that happen to? With everyone who isn't prepared. And we're going to sort that out for you today. The problem wasn't the market, it was the chart I was using. If you've ever taken a stop-loss order thinking
[00:34] everything was alright, completely alright, this video is for you. Play the intro.
[00:48] Let's start from the beginning. What is Reikenash? Actually, in Japanese it means middle leg or, in our case, middle bar. Instead of showing the price per second, no. It calculates an average of the movements. The result, um,
[01:03] um, it's a real gem from R. A much cleaner graph. It's as if the normal distribution represents the family group, right? Full of messages, stickers, 2-minute audio clips, a complete mess, and nobody knows what's going on
[01:17] . Kinash, on the other hand, is a summary of the day, showing only what is important. But pay close attention, requiash alone is not enough. He will show you the direction, but he won't tell you exactly when to enter. To do
[01:31] this, we will add two indicators: the exponential moving average of n and the MACD. This is where the strategy starts to get interesting. So let's move on to the first indicator, which is the nine-period exponential moving average. It's a
[01:45] line that closely tracks prices, allowing it to react quickly to changes. directional filter. So what does that mean, right? If the price is above that average, we only think about buying. If the price is below average, we only
[01:59] think about selling. It's simple and easy. Simple and easy, like giving a like or subscribing to our channel. Are you going to tell me you didn't know there's a button to you didn't know there's a button to subscribe and also to comment
[02:13] below if you have any questions or suggestions for our next And if you want, calm down, calm down, calm down. And if you'd also like to chat with Instagram. There you can talk to us anytime you want and we
[02:28] don't charge you, okay? Yes, exactly. And also take a look at this playlist where we show other indicators and other chart modes so you can understand how to trade in the best way possible. And now we move on to the second indicator
[02:44] used, the MACD. I know, the name alone might sound intimidating if you're just starting out. Calm down, calm down, calm down. Let's not panic. The MAC (Moving Average Cost) will compare two moving averages and show whether the movement has strength or, in other words, if it is losing
[03:00] momentum. And this is very important for you so you don't make any mistakes with the king you think he is. When the MACD line is above the signal line, it obviously indicates buying pressure. When she is down, a selling force. And
[03:15] down here we have the histograms, those little bars, right? When they are growing above zero, it will obviously show that the movement is gaining momentum. If they are falling below zero, obviously the downward movement is
[03:31] gaining momentum. In short, MC is a market lie detector. If the chart appears to be going upwards, but the MACD does not confirm it. H, don't trust, be suspicious.
[03:43] explanation. We're here, right, with traditional candles. We're going to switch to Remember that we are using a 10- minute timeframe, as shown here in the mini-index,
[03:56] other chart, OK? Of course, you'll have to adapt and test to find out what the best input would be. Right-click, then, indicators. Let's look for our MAC using the histogram line.
[04:12] uma mensagem no direct do nosso Instagram, a gente pode mandar, né, para você essa regra de coloração aqui para deixar bonitinho aqui, vermelhinho e verde para ficar melhor de visualizar. And also right-click, indicators,
[04:27] also right-click, indicators, moving average, insert nine-period, OK? Double-click the moving average to make it look nicer. First, to make it look nicer. First, convert to exponential mode, then add
[04:39] a small pipe here to make it thicker for better visualization. Setup. Ready. So now, what would our input signal be? As an entry signal, we'll be looking for green candles, right? Down payment on the purchase, right? Of course. So, for buying,
[04:54] then, green candles. The candles must be closing above the be closing above the nine-period moving average. And our MACD also needs to be crossed, right? Our MACD line here needs to be crossed
[05:08] upwards. This gives us the right to participate in the purchase. And for selling, you just do the opposite, right? Oh, little padaã. Exactly. For sale, it's the opposite. In other words, closing with the price
[05:20] below the nine-period moving average, with the MAC crossing downwards, indicates strength, right, of the bearish trend MAC. These signs are super simple. So let's get down to business, shall we ? Let's go. Let's look for it then. Oh, Candle closed
[05:35] Let's look for it then. Oh, Candle closed here in the green, above the nine-period moving average. OK. After that, let's look at the MACD down there. He is on the rise. It's growing and has already crossed upwards too, right? So it's also an
[05:49] entry signal. So we'll enter right after this candle closes. Let's click here. Tum. We entered the purchase. Now comes the most important part. Where is the stop sign? We're going to make the stop really short. The stop loss will
[06:03] always be placed at the low point of the first red candle. Which would be the first red candle. Which would be the first red candle? This little goat here. If you want, over time you can raise your stop-loss to gradually
[06:18] increase it at the next lows, OK? But for now, it's the first red candle; we'll put it here at its low. So, where is our gain? Our game, as we always say, requires you to test it to find the best way to
[06:33] operate it. You can do what I was saying, that trading stop, moving little by little until a point triggers your stop. You can do, for example, a two-for-one deal. So let's see what two to
[06:46] one would be here. In this case, a two-for-one situation would be one where you're risking an 800-point stop loss to gain
[06:58] 16,600. In this case, it was beautiful, it even went up to 2100 points. You can do two for one, so like I was saying, three for one. Ideally, a two-to-one ratio would be more precise, but you'll have to test and
[07:14] find out what works best for you . Let's now look at a sales strategy that followed immediately. Right after that, it closed down here , right? Look at this price! Below the average of nine. Even this one
[07:29] closed below the average of nine, so that already indicates a sell, right? O reiknash vermelho, já está fechando abaixo da média de nove, porém, ó, vamos olhar aqui o MCD, o MACD, OK, ele está mostrando que está perdendo força, porém
[07:43] ele não cruzou, né? He didn't cross here for the sale. So that's precisely why we're not going in . Ah, but I could have sold it sooner. I could have made money, I could have, but what if it went wrong and it was just a one-off
[07:57] return, a small pullback before going up again? We don't know. So the MCD will be that, right, that strength trend filter. Let's look further ahead. Further on, how far did he cross? During this period
[08:11] here, look. You can see that it crossed from this candle here to this one. So, when he to this one. So, when he crosses the road, that's when we make our sale. crosses the road, that's when we make our sale. Sell here where our stop is, remember?
[08:24] At the current high of the green candle. Let's do a two-for-one here to see how it do a two-for-one here to see how it goes. Two for one here. Then you 'll score 1000 points. Here, our stop would be at 1000 points, so our game
[08:37] would be at 2000 points. The day is over, right? You had to go to the next day. In other words, if you wanted to, you know, move on to the next day, OK, but we don't recommend it. So you would end up here with a game of, let's see, a game
[08:51] close to 100 points. So, 1200 points here plus 1600 points here, we here plus 1600 points here, we get 2800 points. That day here was beautiful, without a single interruption, without any headaches, and without any butterflies
[09:06] in my stomach. Now, the next day, we can see here that there was indeed an entry point . Let's see if it worked. Okay, so the candle closed here. Let's go. The intersection was down here. So the entrance would be right here, right? This
[09:22] candle closed. We'll be entering here right at the opening of the next candle. But opening of the next candle. But look, it's a really big problem. The stop loss is huge, and you can see that it's somewhat disproportionate compared to the
[09:37] previous part, right? That was a very strong candle here. Here comes the part about being flexible, about not just using it like look and say, "Wow, look at this. It's impossible that
[09:51] my stop loss is going to be, let's see how many points here, 1000 points right now." Yes, it's a very big stop. So, ideally, we would shorten the stop loss and place a stop loss here below, to reduce your risk. But if you
[10:06] want to trade, you're willing, and your risk management is all right, let's see what happened, whether it was successful or not. So, stop at 1000 points. Look, it did n't work. It worked here later this afternoon
[10:23] , right? For a while, he even managed to score up to 1200 points here in the game. However, further down the line we'll take the stop-loss order. That's what I told you, I thought stop-loss order. That's what I told you, I thought that stop loss was very well executed based on the
[10:36] be a little more doing. Here's a very important tip and an essential warning that you should always keep in mind. No indicator is
[10:51] magic, no setup, no strategy will work 100% of the time. What changes is the work 100% of the time. What changes is the probability being in your favor and the clarity you have when making a decision, knowing exactly what is happening in
[11:06] And remember, never risk more than you can afford to lose. The strategy may seem good, but without risk management, it won't save you. And with that, we have a video up here, let me tell you about it, which is precisely about
[11:20] our most important video on the channel, and few people have seen it. The function of risk management. And part of risk management is , for example, testing in a simulator first, not just playing without
[11:36] practicing. To take a penalty kick, you have to know how to strike the ball. Understand the consistency. So, to summarize, recinash will serve to provide a clean reading of the trend. The moving average filters out
[11:52] trend. The moving average filters out the direction, while the MACD comes in to show where the strength is and ensure that the strength is with you. Mas você não vai precisar de força nenhuma, amigo, para clicar ali no joinha, dar um
[12:05] curtir o nosso vídeo aqui, se inscrever em nosso canal e também comentar aqui embaixo caso você tenha alguma sugestão ou alguma dúvida. Be sure to visit our Instagram, follow us there, and feel free to send us a message if you
[12:19] need to. We're always available, and all of this will help us bring you more content, because YouTube likes that kind of engagement, okay? And speaking of showing more content, I'm sure you'll like this other video
[12:34] about rec, another strategy that will greatly help you in your greatly help you in your trading arsenal. Until next time. M.




⚡ Saved you 0h 12m reading this? Transcribe any YouTube video for free — no signup needed.