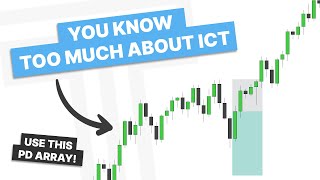

Why You're Failing at ICT: Too Many Concepts
53sDirectly addresses a common pain point for traders, offering a clear 'aha' moment about focus.
▶ Play Clip"The title promises to explain why you're failing with ICT, and the video delivers on that premise with practical advice, though it could be more concise."
This video explains why traders often fail when using ICT (Inner Circle Trader) concepts, attributing the issue not to a lack of knowledge but to an inability to focus on a single concept. The presenter advocates for selecting one 'PD array' (e.g., fair value gap, order block, change in state of delivery) and mastering it, rather than trying to use all concepts simultaneously, which leads to confusion and inconsistent execution.
Most people fail trading ICT not due to lack of knowledge but due to the inability to filter through concepts and focus on one.
PD arrays are individual concepts such as fair value gap, inversion, breaker block, order block, change in state of delivery, and order tool or Fibonacci tool.
To choose a PD array, ask: which one is easiest to see on the chart, which makes the most sense, and how much confirmation do you need?
Confirmation can range from little (entering below a low in a downtrend) to more (waiting for an inversion or change in state of delivery) to a lot (looking for fair value gap or breaker formation after structure shift).
Find a PD array that suits you, forget the rest, and stop trying to use every concept. Use the selected PD array in combination with highs and lows (liquidity).
In a reversal, the sequence is: turtle soup (sweep of highs), inversion (closure below fair value gap), change in state of delivery (closure below), then breaker block and fair value gap. Each adds confirmation.
Using multiple PD arrays leads to inconsistent entries and stop-losses, making it hard to journal and refine a model. Focusing on one PD array makes the model repeatable and mechanical.
For the presenter, using change in state of delivery means entry on the close through a series of up-close candles, with stop on the swing high. This simplifies the model.
If using inversions, look for bullish fair value gaps that get inversed. This also works; it's about choosing what works best for you.
The point is that you don't need to know more; you just need to focus on less and master that one concept.
On a 3-minute chart, the same sequence (turtle soup, inversion, change in state of delivery, breaker block, fair value gaps) appears, but marking all of them clutters the chart. The presenter only needs the sweep and closure through candles.
You don't need to understand everything. Learn one PD array, master it, and read price action using that plus highs and lows. This reduces overwhelm and allows clear execution.
The key to success with ICT concepts is not to accumulate more knowledge but to simplify and master one PD array, using it consistently with highs and lows. This approach leads to repeatable, mechanical trading and better execution.
What is the main reason most people fail trading ICT according to the video?
Not due to lack of knowledge, but the inability to filter through concepts and focus on one.
00:11
What are PD arrays?
Individual concepts such as fair value gap, inversion, breaker block, order block, change in state of delivery, and order tool or Fibonacci tool.
00:24
What questions should you ask yourself when choosing a PD array?
Which one is easiest to see on the chart? Which one makes the most sense? How much confirmation do you need?
01:21
What is the sequence of reversal confirmation mentioned in the video?
Turtle soup, inversion, change in state of delivery, breaker block, and fair value gap.
04:07
Why is using multiple PD arrays detrimental?
It leads to inconsistent entries and stop-losses, making it hard to journal and refine a model.
06:29
What is the presenter's preferred PD array?
Change in state of delivery (and opposing candles or order blocks).
07:07
What is the final advice for improving trading with ICT?
Learn one PD array, master it, and use it with highs and lows. Remove things from your strategy instead of adding.
10:30
Failure is due to lack of focus, not knowledge
This reframes the common problem traders face, shifting the solution from learning more to simplifying.
00:11Use one PD array with highs and lows
This is a practical, actionable principle that can be immediately applied to trading.
03:12Consistency enables data collection
Highlights the importance of repeatable models for journaling and refinement, a key to long-term improvement.
06:29Master one concept, not all
Reinforces the core message that depth beats breadth in trading skill development.
10:30[00:11] How's it going everyone? In today's video, we are going to talk about why most people fail trading ICT. And it's not due to the lack of knowledge or the lack of understanding the concepts. It's just the inability to filter through the
[00:24] just the inability to filter through the concepts and focus on one. So in today's video we are going to talk about choosing a PD array. So when I am talking about PD arrays what do I mean? I mean the individual concepts such as a
[00:37] fair value gap, an inversion, a breaker block, an order block or a change in the state of delivery and even an OT or a Fibonacci tool. Now, it's great to understand all of these concepts and be able to see them, but when it comes down
[00:52] to actually trading with these concepts, is it beneficial or more detrimental to try to use all of them? And let's go take a look at that. If you've seen my is what I look for in a reversal forming. We have a turtle soup, an
[01:08] delivery or the formation of an order block, a breaker, and a fair value gap. Now, if I'm looking at this all together, all at once, it's a bit clustered and there's a lot to look at.
[01:21] I don't really have my focus on anything, right? So, I need to go ahead and decide on which one I want to focus on. So, how do I go about choosing a PD array to use or to master? And these are the questions I would ask myself. Which
[01:36] the chart? Which one makes the most sense? And how much confirmation do you need? So, what do I mean by that? So if we go back to this slide here, which one is actually easiest for you to see when you look at this? What is the first
[01:50] thing that you spot? For me, it's a change in the state of delivery. These down close candles here that sweep out the low and then is closed over. That what my strategy is based around. However, if it is an inversion for you,
[02:03] then use that. If it's a fair value gap, then use that. Now, the next thing I want to talk about is how much confirmation you need. Some people prefer a little confirmation, some prefer more, and some prefer a lot of
[02:17] more confirmation and trade the continuations as I already have and I'm not trying to catch that reversal. So, what does it look like with a little confirmation? Well, if I was going to be entering below this low,
[02:32] I'm currently entering in a downtrend and I don't really have much confirmation that a reversal has formed here. However, if I want a little bit more confirmation, if I let a inversion form or a change in the state of
[02:45] delivery after the running of this low, that's more confirmation to this reversal to get on side with the move in the other direction. If I want even more confirmation, that's when I can look for that fair value gap or the breaker
[02:57] formation as we have then clearly shifted structure and continuing trend in the other direction. So, my final words are to find a PDA that suits you. Forget the rest. Stop trying to learn and use every single PD array and mark
[03:12] up all the chart. While this is something you can do in hindsight and something that you're going to be able to do real time. And so it's a lot easier to execute when you're only focused on one PD array. So the next
[03:26] thing I would say is use the one PD array you selected and then use that in combination with highs and lows. So, for instance, if I'm going to use a fair value gap, I'll also look at highs and lows. If I'm going to use a order block,
[03:39] I'll also use highs and lows. You really have to use highs and lows or liquidity in combination with the selected PDA. And then the last thing is to stop hit a little struggle in your trading, it doesn't mean you need to throw
[03:54] everything away and find something new and shiny to focus on. That's not going to fix your problems. you just need to lock in on one strategy and one concept. So, let's get into the charts and I'll show you what I mean with this
[04:07] presentation. So, here we are in our first example and you can see we have went and taken out these highs to our left or our previous days highs. Now, if we're going to have an order of a reversal, the first thing we have would
[04:20] be a turtle soup, right? So, a sweep above highs and that would have the does that mean? It means that if I was going to look to take an entry in here, I have no protected high or anything like that to be trading off of. So many
[04:36] times price, unless it's going to reverse right here, will go ahead and stop that out numerous times before catching a winner. It doesn't have a lot of confirmation that the reversal has formed. So the next thing would be an
[04:51] inversion. That would be number two. So if we have a closure below this fair value gap here, that would give more confirmation that a reversal or this high has been put in. So as we let this play forward, you can see there we get
[05:06] the closure below. And so an entry like this with my stop on the high, that gives a little bit more confirmation that this high should remain intact as we've disrespected this fair value gap here. Now what would be the next in the
[05:22] confirmation or order of reversal? It would be a change in the state of delivery. So waiting for the closure below there. Here we get the closure below forming a change in the state of delivery. And at this point I can look
[05:34] to put my stop on the bodies or above these swing highs or up here looking to target those same lows. And you can see now we have more confirmation because we've had the sweep, we've had the inversion and the change in the state of
[05:48] delivery as well as the breaker block. So from this swing high to this swing low, you can see we also have a breaker block. Now what else do we have? We have a fair value gap in here. And so now this is more confirmed. So you can see
[06:02] as we go from the turtle soup to the breaker block and fair value gap, there is more and more confirmation that this has formed a high and is starting to trade away from it. So letting this play out, let's see what
[06:16] happens. You can see we reach into that fair value gap and then we eventually trade lower to this low. So what do I want to talk about here? Well, the main thing I want to talk about is if you're trying to consistently use all of these
[06:29] PD arrays, where is your actual entry? When are you going to take an entry? Where is your stop-loss? How are you going to start to get consistent data in journal and refine your model if you're taking entries that are always
[06:41] different? So, with this, how do I clean it up? Well, I'm going to decide how I want to trade it. For me personally, like I said, I use the change in the state of delivery. So, what would I do? I would essentially ignore the rest of
[06:53] these. I look for the sweep, the closure through the series of upclose candles. In this case, it's one. And what does this do for me? It gives me a simple and repeatable way to gain entry into the market and collect data. So, if you
[07:07] the change in the state delivery, I know my entry is always on the close through that and my stop is either going to be on this swing high or another high that is around this body level. And once again, with a continuation, how do I
[07:21] anticipate that? Well, instead of just entering on a fair value gap here, I'm always going to be looking for what? The series of up close candles into an important level. And I'll be looking for those to trade away from. So, you can
[07:34] see my model is now more repeatable and mechanical because instead of focusing on five different PD arrays, I'm focusing on one. So, what would this look like if instead I was only going to use inversions? Well, if we clean this
[07:48] up here, we take a look at using only inversions and marking that out. You can do the same thing, right? We're just looking for bullish fair value gaps that then get inversed, right? And you can see those also work out as well. You
[08:03] just have to decide what works best for you. For me, that's using change in the state of delivery and opposing candles or order blocks. What if you wanted to use breaker blocks? Well, you're going to do the same thing over and over. The
[08:16] get across the point that you don't need to know more. You just have to focus on less and master that. So, digging a little deeper into this example. Let's go ahead and rewind price action to right here. You can see we've had the
[08:31] reversal and then each of these moves back up into the opposing candles is an opportunity to sell as I'm expecting a continuation lower as long as price respects these areas. So, if we're taking a look here, what do we have? We
[08:45] have an opposing candle here or a move higher, close below. And I'm expecting this to hold instead of just taking a limit order here. I would be looking for a swing formation to occur. If you've seen my intro to my fractal model, that
[08:58] will make sense. And then let's drop down to the 3minut cuz we are on the 30 minute and that is my time frame alignment. So as we drop down here into the 3minut time frame, what do we notice? We can see we have that sweep
[09:11] out which would be the turtle soup. Then we have what? The inversion. And then we have the change in the state of delivery which my indicator has marked out. Do we have a breaker block? We do. Once we purge this low and close, I can expect
[09:24] the breaker block to hold. And then do we have fair value gaps? Well, we also have fair value gaps in here being respected. So you can see I could go ahead and mark all those things out. But
[09:37] does that really help me? Is that going to show me more information or is it just going to cluster my chart and make things more confusing? For me, I don't need all of that. I just need to see the sweep of this previous high and then the
[09:50] closure through the series of candles that made it. That's enough for me to do I look for? I just look for these opposing candles. So, you can see it's a lot more simple. Instead of marking out
[10:02] five different things, I'm just focusing on mastering one. So, as we let that play out, what do we notice? We have a change in the state of delivery. We retrace back up. We close below. Expect that to hold. And we get that
[10:15] continuation lower. And you can see I only used one PD array to understand this price action using a different PD array? Sure, you could. You can use fair value gaps. You could use breaker blocks. You can use whatever you want.
[10:30] The whole goal in this video once again is to tell you you don't need to understand everything. Learn one PD array, master that, and figure out how to read price action using that as well as highs and lows. And if you listen to
[10:45] my model, you realize that's exactly what I did. I use highs, lows, and opposing candles or the change in the state of delivery. And that's all it is. I keep it very simple. And what does that allow me to do? It allows me to
[10:59] overwhelmed with what is going on in price action because my model is so different things and that doesn't overwhelm me and allows me to have a clear mind to actually execute on my analysis. So, I hope you enjoyed the
[11:15] video. I know it's a bit shorter. I know it's a bit different than my normal content, but I do think it is an important video for some people to see. you don't understand enough about technical analysis or ICT, you most
[11:29] likely do. It's just you're trying to do too much. Instead of trying to add to your strategy, look to refine your strategy. Remove things instead of adding. Make it more simple because at the end of the day, execution is what
[11:43] matters. It's not about how you can mark up a chart in hindsight. So, I hope you have a great rest of your day and I'll see you guys next time.
⚡ Saved you 0h 12m reading this? Transcribe any YouTube video for free — no signup needed.