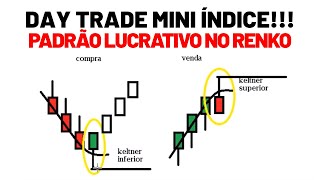

3 Negative Boxes + Reversal = Buy Signal!
60sClear, step-by-step entry rule that viewers can immediately test, creating high educational value.
▶ Play Clip"The title promises an 80% success rate, which is only achieved with a 30-point scalping target, but the video delivers a solid, detailed strategy with real backtest data."
This video presents a day trading strategy for the Brazilian mini-index (WIN) using a 10R Renko chart and the Keltner Channel indicator. The strategy focuses on identifying reversal boxes at the channel's upper and lower lines to generate buy and sell signals, with a specific trading window from 9:00 AM to 9:20 AM. The presenter shares backtest statistics for various profit targets, demonstrating the strategy's adaptability and potential for consistent returns.
The strategy uses a 10R mini-index chart with the Keltner Channel indicator configured with deviation 2, period 10, and arithmetic type.
For a buy signal, look for a sequence of at least three negative boxes, followed by a positive reversal box whose shadow touches the lower Keltner line and closes above it.
For a sell signal, look for a sequence of at least three positive boxes, followed by a negative reversal box whose shadow touches the upper Keltner line and closes below it.
Initial stop-loss is placed at the low (for buys) or high (for sells) of the entry box. As new trading windows close, the stop-loss is moved to the low/high of the most recent closed box to lock in profits.
If the first entry box closes at a loss, the trade is closed immediately without waiting for the stop-loss to be hit.
The strategy only operates from 9:00 AM to 9:20 AM on the 10R mini-index chart, limiting trading to a 20-minute window.
Profit targets can range from 30 points (scalping) to 500 points, with the presenter demonstrating a 200-point target as a balanced example.
With a 200-point target, backtesting since April 26, 2024, shows 558 trades, a profit factor of 1.31, a 40% success rate, a payoff of 1.66, and a 20% return.
With a 30-point target, the success rate rises to 83%, demonstrating the strategy's effectiveness in a scalping format with a steeper capital curve.
The strategy offers a systematic approach to day trading the mini-index, with clear entry, stop-loss, and target rules. Backtest results show consistent profitability across various target settings, making it a versatile tool for traders.
What is the configuration for the Keltner Channel indicator in this strategy?
Deviation 2, period 10, arithmetic type.
00:32
What pattern is required for a buy signal?
A sequence of at least three negative boxes, followed by a positive reversal box that touches the lower Keltner line and closes above it.
00:45
What pattern is required for a sell signal?
A sequence of at least three positive boxes, followed by a negative reversal box that touches the upper Keltner line and closes below it.
02:32
How is the initial stop-loss placed?
At the low of the entry box for buys, and at the high of the entry box for sells.
03:33
What is the rule for moving the stop-loss?
As new trading windows close, move the stop-loss to the low/high of the most recent closed box.
03:50
What happens if the first entry box closes at a loss?
The trade is closed immediately without waiting for the stop-loss.
05:02
What is the trading window for this strategy?
From 9:00 AM to 9:20 AM on the 10R mini-index chart.
05:17
What are the backtest statistics for a 200-point target?
558 trades, profit factor 1.31, 40% success rate, payoff 1.66, 20% return.
11:34
What is the success rate with a 30-point target?
83%.
15:08
Clear Strategy Setup
Provides a specific, actionable configuration for the Keltner Channel, making the strategy easy to replicate.
00:18Defined Entry Criteria
The reversal box pattern offers a clear, objective signal for entering trades, reducing ambiguity.
00:45Trailing Stop-Loss Method
The method of moving the stop-loss to recent box highs/lows is a practical way to lock in profits and manage risk.
03:33Backtest Performance
The 200-point target shows a positive capital curve with a profit factor above 1, indicating long-term viability.
11:34Scalping Success Rate
The 83% success rate with a 30-point target demonstrates the strategy's adaptability to different trading styles.
15:08[00:18] Today I want to share with you a setup for the 10R mini-index chart for explain to you how this strategy works. We will use the Keltner channel indicator as a basis . And we're going to configure it like this
[00:32] . And we're going to configure it like this . Deviation 2, period 10, arithmetic type. It's clearly specified here, look. What is the Kelt channel configuration ? Just read below and you'll see. You insert this indicator
[00:45] into your chart and configure it this way, as written here. And we're going to work on buying and selling. In the case of a purchase, we will use the lower Keltner line as a reference. And in the case of sales, we'll use
[00:57] the top Kelchen line as a basis. When making a purchase, we'll want the following: a pattern of at least three negative box sets in sequence. You can see that we had a sequence of three negative boxes here.
[01:12] See here? Once you get this sequence on your chart, you need to wait for the next pattern. We're going to need a pattern. We're going to need a positive box whose
[01:27] positive box whose shadow touches the bottom line of the Kelten. Look, you can see that this box here, it was a positive box, as you can see.
[01:41] as you can see. His shadow touched the lower line of the Kelut and he closed above. See? It's a reversal box, right? It's a a reversal box, right? It's a reversal box on the bottom row of the Keltner. And
[01:54] this box needs to appear right after a sequence of at least three negative boxes, understand? What we're looking for here is simply a reversal in the lower Kelstner line. That's all . So, it's very important that
[02:07] we get this reversal box here, which is our entry trigger. It is our buy signal. Once we see this box appearing right
[02:19] after a sequence of three negative boxes, then we enter the buy phase. We enter the market buying phase. In the sale, it will be the opposite. We're going to need a sequence of
[02:32] of at least three positive box sets. Why do I say "at least"? Because it's possible that if we get more, the price might start to climb above the Keltne line and keep going up , up, up. Yes, what I
[02:46] 'm saying here is that we need at least three positive boxes before we get the reversal box. So, in this case we had three positive boxes, and then we had the reversal box. And the
[03:03] the reversal box. And the characteristic. Look, he needs to touch the top line of Kelner. And then it closed
[03:18] below the upper Kelner line and it closed negative. Once we have this here, we enter the market sale phase. To the market, right? market sale phase. To the market, right? So, in this strategy, once
[03:33] we enter the market trade, the stop-loss will start here, at the low, in the case of a buy, at the low of the entry box. And in the case of a sale, it will start at the maximum.
[03:50] But the important detail here is this: as soon as you have a new trading window closing, as soon as you have a new window, you're going to raise that stop loss,
[04:06] okay? So, for example, let's suppose we entered here and the market went up. What do we do? We'll take this stop loss that was here, and we'll move it up to the low of the next trading session.
[04:20] to rise. So, I'm going to raise my stop loss again, I'm going to bring it here. That's the idea behind our stop, okay? It will work that way. And in sales it will be the opposite.
[04:33] You entered the sell position, the stop is here, at the high of the signal box, the at the high of the signal box, the entry box, right? So, what happened in the market? What are you going to do? Your stop loss that was here, every time you have a new trading
[04:47] here, every time you have a new trading window that closes, you lower the stop loss, lower the stop loss, lower the stop loss. So I need to clarify the following for you: our initial stop loss starts here. It starts here, but if by any chance
[05:02] we have a negative closing in the very first entry point, we'll end the operation, okay? We don't even expect him to come back and hit this stop sign here. Let's suppose I came in here and this stall here went back and closed at a
[05:17] loss, I would just close the transaction. Another important detail is that this setup will work from 9:00 AM to 9:20 AM. So it's only 20 minutes of operation. We're on the 10R chart of the mini-index. He will
[05:31] only operate for 20 minutes. It's from 9:00 AM to 9:20 AM. And I'm here on the chart with a buy signal for us to see. Look, notice that it's exactly what I showed you there. Here, you had a sequence of three negative boxes
[05:46] had a sequence of three negative boxes positive box, which was a reversal box on the lower Kelt chart, right? So, once you have this here, you wait for it to close, and then in the
[06:00] next box we'll go into the grocery shopping. The stop starts here, look. The stop-loss order begins here. The target, you can position it in different ways. I'm going to show
[06:14] you here in the backtest that you can set a target ranging from a scalping strategy to a longer target of 500 points. So you can set a target of 30
[06:26] points up to 500 points and that will definitely change your capital curve, right? But even with different types of targets, the strategy continues to yield interesting results, right? In this case,
[06:39] interesting results, right? In this case, I'm setting a target of 200 points. So if I go in here, I'm going to set a target of 200 points, which will be more or less here. That's when I got involved in the operation. As soon as this box
[06:52] closes, I'm going to grab this stop and pull it over here, see? I'm pulling the stop this way . But I need to wait for this booth to close, right? This stall needs to close. And then he went there and took
[07:06] my stop loss here, because I raised the stop loss, right? Get out of the operation, okay? And so we wait for another sign here. This was not a reversal box. Why didn't it happen? Because he didn't touch it, he didn't touch the
[07:21] bottom line of the Keltne, so it doesn't count. He needs to touch the bottom line of the Keltne and then close it positive. Since he didn't touch it, this won't be considered a reversal box, okay? You have to play.
[07:35] okay? You have to play. Let's go. Let's take this. sales pattern. He's creating a wind pattern, because He's creating a wind pattern, because we already have
[07:49] three positive boxes in sequence here. If we have a reversal box at the top of the sell signal. Oh, just like it happened here, exactly like the drawing I showed you. Three positive boxes and even more. You
[08:05] pretty long sequence of positive boxing matches here. Why do I say three? Because we need at least three positive box sets
[08:17] okay? So here, look, three positive boxes. And then, following that, we had a reversal box on the top line of the Kelchner. So how does this reversal box happen? He needs to touch the top line of Kelch, right? His shadow
[08:33] needs to touch and he needs to close it below, right? Closing negative below the lower K line. It's quite easy to visually understand what this reversal box for selling will look like. And once we have this
[08:49] reversal box on the sell side, we're going to enter the market on the sell side with a stop loss at the high at the high of the reversal box. And we're waiting for
[09:03] this stall to close. As soon as it closes, we'll move the stop here, to its high. Oh, another box here. Let's move the stop here . Let's see, look, another box here. Let's
[09:18] move the stop here. What is the target I set here? In this case, a target of 200 points. So, the target is more or less here, on the bottom line. Let's see. Another box closes,
[09:35] pull the stop here and the target has been reached. Target of 200 And as I told you, we can set different types of targets. Here
[09:47] I set a target of 200 points. You can set a target of up to 500 points or even a target of 30 points. Oh, a target of 30 points would be a scalping strategy, it would stay around here. That's quite interesting too. The strategy
[09:59] works well in a scalping format. And then you do your tests, right? What I'm ready-made strategy. I'm sharing an interesting pattern I discovered sharing this with you so that you can do your own research, your own
[10:15] analysis of the chart, so that you can verify for yourself that this is an interesting pattern, okay? Just a reminder that I'm using this strategy here, it only operates from 9:00 AM to 9:20 AM on the 10R chart of the mini-index. Look
[10:31] operation here, look. This happened on August 29, 2025, during business hours, which are from 9:00 AM to 9:20 AM. We had a the reversal box at the lower Kelt line, right? He entered the market, went there and
[10:47] hit the 200-point target. He was conducting the operation here, right? Because he kept raising the stop-loss orders here, see, raising them, raising them, until he hit the target there. You can see it here in the sale too, look, the operation is here as well. And it
[11:04] will always happen in this format. The operations are very similar. If he doesn't close the score at zero to zero, he'll probably hit the target, okay? Like what happened here, look. Many trades in this strategy close at
[11:20] in this strategy close at breakeven, and if they don't close at breakeven, they 200 points. And so I want to share the statistics with you. Look at the statistics here. Working with a target of 200 points, we had this
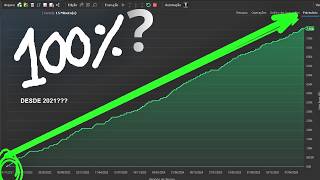
[11:34] capital curve here, look. This was the capital curve on the 10R chart of the mini- index. Here it is, the upward-sloping capital curve , backtesting it , backtesting it since April 26, 2024.
[11:46] In total, we had 558 trades, a profit factor of 1.31, a 40% success rate with a payoff of 1.66, and a 20% return. And here you can see that
[11:59] we had 49 transactions generated. Look here. Here are the operations, as you can see, right? There are several operations involved in this strategy; it's easier to see them here on the operations chart. You realize how
[12:13] operations chart. You realize how interesting this comparison is, right? As you can see, that's why we have a payoff here of 1.66 and a 40% success rate. The success rate here is low because of the zeroed-out operations,
[12:26] right? That's what you have to consider: many trades will be closed out, and then those won't count as winning trades, okay? That's why the success rate is lower here. So you have to understand that many trades that don't
[12:39] hit the target are closed at break-even , okay? So it doesn't mean that 60% of the operations are at a loss. That doesn't mean it. This means that a large portion
[12:51] of the trades that don't hit the target end up breaking even . So here I'm showing you the target of 200 points. Let's put a different target for you to see. I've set a target of 300
[13:05] points here. So I set a much larger target, and then you'll have this capital curve larger target, and then you'll have this capital curve and these statistics here. I realize that we're still only getting 40% of the answers right.
[13:26] target points. Here's the capital curve for you to see . This is the chart of the operations . And we're still at 40% accuracy. And we're still at 40% accuracy. 40% accuracy rate, pf of 1.67.
[13:41] You can see here now that I've put 500 target points here. We have this capital curve here, as you can see now. It fell. We have a 39% success rate, a payoff of 1.66,
[13:55] success rate, a payoff of 1.66, 551 trades, and a profit factor of 1.30. 551 trades, and a profit factor of 1.30. Right? Here it is. So in this case, I target. We can reduce it, look. I'll set a target of 100 points for you to
[14:09] see. Here it is. Target of 100 points. I shrunk down . The initial score I showed a target of 100 points. Oh, the capital curve turned out really nice. And the capital curve, you have these statistics here, look. We have these numbers.
[14:27] Let's reduce it even further. I'll set a target of 50 points for you to see. With a target of 50 points, we have this capital curve and we're here with a much higher success rate. Now it's at 70% accuracy,
[14:41] see? It was at 70% accuracy and the capital curve is this one here. capital curve is this one here. Let's put 30 points here. Now we're leaving it in proper scalping format, right? just like a scalp.
[14:55] So I'm going to show you what the capital curve looks like in scalping format, we have this capital curve here, a
[15:08] very interesting curve, right? It's going really well up here, look. And the success rate went up here, look. And the success rate went up quite a bit, right? It went up to 83%. It went up from 40% to 83%. Ah, I got this one scalped, right? And
[15:22] so there were 558 operations. So then you have the statistics, right? Then you configure the setup however you prefer, but do your own with you here is just a pattern that I've noticed has had great results here
[15:36] in Pack Test, right? And that's what I'm sharing with you. Okay, take this pattern, do your own tests on the graph, your own studies, and alright? And we'll see you in the next video.
[15:48] Receive the channel's various strategies. There are dozens of open-source codes that you can use freely in your profit chart. Enroll today and receive, in addition to various setups, complete training teaching you step-by-step how to
[16:02] create strategies in the Profit Chart editor. And best of all, when you our support group, where we share various codes and create several strategies based on your feedback. Do you need to
[16:17] program a setup and don't know how? Through our support service, we create the code for you. Enroll today and get access to all of this right away . We share the setups with 100% open source code. You can
[16:32] request as many codes as you like throughout the two months of support. You will learn from scratch how to set up various trading systems and obtain statistics to discover winning strategies. A training program
[16:46] designed to teach traders to be more than just ordinary investors; they should develop new strategies for the stock market.
[17:05] [Music] [Applause] [Applause] [Music]


⚡ Saved you 0h 17m reading this? Transcribe any YouTube video for free — no signup needed.