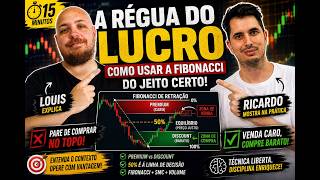

Stop Using Fibonacci Wrong!
45sHigh frustration and curiosity about Fibonacci misuse grabs attention immediately.
▶ Play Clip"Title promises correct Fibonacci usage and delivers a clear, practical guide with the premium/discount concept."
This video explains how to use Fibonacci retracement levels correctly in trading, focusing on the 0%, 50%, and 100% levels as key zones. The hosts emphasize that Fibonacci is not a magical support system but a ruler to identify premium (expensive) and discount (cheap) zones. They provide a practical example of buying near the 38.2% level after a pullback below 50%.
Many traders misuse Fibonacci by treating it as a magical support system, leading to confusion with multiple lines.
Only three levels are needed: 0%, 50%, and 100%. The 50% level is the equator line representing fair price; above is expensive, below is cheap.
In an uptrend, buy only when price retraces below 50% (discount zone). Buying above 50% means overpaying and risks stop-out due to lack of liquidity.
Draw Fibonacci from swing low to swing high. Look for support/resistance confluence. In the example, a strong support was identified, so a buy was planned.
Set Fibonacci levels: 0, 38.2, 50, 61.8, 100. Main levels (0,50,100) are thicker (3), secondary levels (38.2,61.8) are thinner (1) for confluence.
Wait for price to break below 50%, then buy near 38.2% (discount). Optionally place a second order near 50% for cheaper entry. Stop loss below the swing low.
Set take profit at 100% Fibonacci level (or 161.8% but riskier). Use a 2:1 risk-reward ratio or simply target 100%.
BingX exchange offers demo account, copy trading, low fees, and integration with TradingView. Promo: 0% closing fee until July 30.
Fibonacci is a GPS to identify profitable zones. Above 50% is expensive, below is cheap. Combine with other indicators for confirmation.
Fibonacci retracement is a tool to identify discount and premium zones, not a magic predictor. By focusing on the 50% level and combining with support/resistance, traders can improve entry timing and risk management.
What are the three essential Fibonacci levels for trading?
0%, 50%, and 100%.
01:39
What does the 50% Fibonacci level represent?
The equator line or fair price. Above is expensive (premium), below is cheap (discount).
01:51
In an uptrend, where should you buy according to Fibonacci?
Below the 50% level (discount zone), ideally near 38.2%.
02:21
Why is buying above 50% risky?
You are overpaying and likely to be stopped out due to lack of liquidity.
02:34
What is the recommended take profit level in the video?
100% Fibonacci level (or 161.8% but riskier).
06:37
What is the main purpose of Fibonacci retracement according to the hosts?
It is a GPS to identify profitable zones, not a magical support system.
10:15
How should secondary Fibonacci levels (38.2%, 61.8%) be used?
As confluence to confirm the strength of the main levels.
04:50
Three Essential Levels
Simplifies Fibonacci usage by focusing only on 0%, 50%, and 100%.
01:39Discount Zone Buying
Key principle: buy only below 50% to avoid overpaying.
02:21Fibonacci as GPS
Memorable analogy: Fibonacci guides you to profitable zones, not predict price.
10:15[00:03] to open your manual. I am Lois. And I am Ricardo. Lis, I'm tired. Everyone says Fibonacci is a divine sequence, but my chart looks like a rainbow because of all the lines it creates. Sometimes I buy at 38 and
[00:16] then it sells at 50, and then there's the 61. It feels like the market is playing understand. Your mistake, and the mistake of many traders, is thinking that Fibonacci is a magical support system. The Fibonacci sequence is not a
[00:29] static wall, it's a ruler. It serves to tell you only one thing. If you don't know which zone you're operating in, well, you 're just guessing. Okay, so today we're going to simplify everything. First, we're going to
[00:42] explain the theoretical part, how Fibonacci works, how to use it, and then we'll go straight to the practical part, as we always do. And since you should do the same, I think it will help our channel a lot.
[00:55] Subscribe to our channel here, like our video, and leave any questions you may have in the comments, both here and on our Instagram. You can follow us Instagram. You can follow us there. So, let's go to the video.
[01:12] members' area. Members, each level has its own advantage. See if you like any of the genres, check out preview videos. Some videos will also only be available to members. So, take a look there, see if you find it interesting, if it's good for
[01:26] channel grow even more, and we'll be able to reach and help even more people. So let's go, little Padawan. If you open the Fibonacci tool today, you'll see several broken levels there
[01:39] . To understand the market context, you'll basically market context, you'll basically need three levels: 0%, 50%, and 100%. But is that all? And what about that
[01:51] Calm down, calm down, calm down. The other levels serve as a confluence, but the secret lies precisely in the balance. The 50 level is our equator line, it's the fair price. Above that point the price is expensive, below that point the price is cheap.
[02:06] we'll reverse it. Imagine you sell iPhones, do you want to cheapest stock? Of course it's cheaper, right? That way, . And it's the same thing in the financial market.
[02:21] If the trend is upward, the market experiences a surge, it rises sharply. When it starts to correct, you'll want to buy, but the big banks will only buy when it goes back below 50%. If
[02:34] you're buying more than 50% off, you're paying too much. And those who pay a high price are usually stopped out by the lack of liquidity. And to help you understand more about a liquidity zone and the importance of knowing about it,
[02:47] we have a really good video about it here. And Fibonacci alone doesn't work miracles. Ideally, when working with Fibonacci, you should work with those zones, you know, with support and resistance. And with that, he will further validate the
[03:00] strength of the support or resistance. So now let's get practical and find out how to use Fibonacci. In the corner here on the right, we have the Fibonacci price. We click on it here, we choose
[03:14] a base, right, and the top, right, of a movement, isn't it? It can be a larger movement, a much larger movement, but in this case we're at 5 minutes and we're going to use movements that are smaller than those in 5-
[03:27] minute intervals. Usually, movements like that are big and long, right? This type of movement is more interesting to him. Now, why didn't I use this other movement here in reverse, thinking about a sell signal, because in this position,
[03:41] looking more towards the bottom, it doesn't indicate a powerful sell signal or anything like that ? So, we're not going to pursue that type of sale. Secondly, remember what
[03:53] we said, we need to find some kind of support or resistance. In this case , we saw that it's a very strong support, because he's already been testing strong support, because he's already been testing it here. So, we'll think about
[04:07] buying it, right? That's why I thought that. If we look back a little at the chart, and look at it as if the day were still unfolding, the day were still unfolding, this would be our
[04:22] buying expectation, a bullish, reversing trend, because of this. So, we've drawn the Fibonacci sequence here. I'm going to double-click here on Fibonacci just to show you how we've set up
[04:38] So, there's not much you can do with this setup; it's just like that. those other two numbers we talked about as just 0, 50, and 100%? These other
[04:50] two levels here will help to tell if it's really cheap or little extra confirmation that we need. We set these less frequently used levels to a thickness of one, and the main levels,
[05:05] 0, 50, and 100, we set to a thickness of three with a fill to make it look nicer, right? We've included this here to show you the levels so you is the zero because it was the beginning of the movement. 38.2, 50, 61.8,
[05:22] and 100%. OK? So this is how we set up our Fibonacci sequence to help us with the operation. So what happened? There was a very rapid, very strong upward movement here, and we're not going to participate in
[05:37] that movement at any point. What are we waiting for? He'll go back below 50%, which is our discount region, where it's cheap, where everyone wants to buy, so he can then sell it for more. So we
[05:52] expect the price to break through that 50% region. Ideally, you should buy at least close to 38.2%. Exactly at 38.2. We expect it to break below the
[06:05] 50% Fibonacci retracement level here, and we'll place a buy order when it hits 38.2 because we want to buy cheap. If you want, place a second order below, roughly 50% of this
[06:21] movement, to buy even cheaper in case the price has fallen further. So it's interesting, for example, to buy one contract here, and then buy the second contract here. Our stop is, of course, right below, right? And with our gain,
[06:37] we can put a two-for- one ratio. So let's go. Here at 38, our stop loss is down here and our take profit is up here. What you can also do with your game is that you don't even need to use two for one or any other game. Your
[06:53] two for one or any other game. Your gain can be exactly your 100% Fibonacci retracement, or as many people use the term, once the movement ends here, we can the movement ends here, we can draw 100% of the projection, OK? But
[07:07] this starts to get dangerous and it might not work, right? Many people here use 161.8%, 8% might not be very effective for holding on the same day, especially when it's a movement with many
[07:21] points, it can be a bit risky to wait until 161, OK? This is the ideal here at 100%, whether it's the projection or the Fibonacci sequence itself. Okay, everyone, just a minute. Many people come to us and ask if we
[07:36] have any platforms to recommend, but we have some news for you. We've partnered with BingX. We chose this exchange because it's perfect for beginners and those seeking security in their operations,
[07:49] especially since you can access global markets through BNGX Trade F. With a single account, you can trade not only crypto, but also silver and gold, the main Forex pairs, and even US stocks like Tesla and Nvidia
[08:04] with low fees and high liquidity. And if you want reliability, know that BingX is one of the official sponsors of Ferrari and Chelsea Football Club. But hold on, if you're still learning, don't worry, Bing X
[08:19] has a demo account with VSTs where you can test all your setups, including the setups we share on our channel, without any risk. And they also have a very, very, very interesting option which is Copic
[08:33] trading. So, if you don't want to trade alone, you can use the trading platforms of other professional traders and profit alongside them. Very copy trading tool. And their interface is entirely in
[08:47] Portuguese, and the best part is, it integrates with TradingView for free. This is very interesting because TradingView is one of the largest trading platforms in the world. And to help you get started the right way, we've
[09:00] left our registration link below, or you can also use our QR code, where you can register, log in to the platform, and if you access it through our link, you'll get a bonus. You'll need to check the website to see what
[09:14] that bonus is. They even have a 0% closing fee promotion until July 30th. It's definitely worth taking advantage of this. taking advantage of this. And remember, always have
[09:28] risk management in place for your operations. BX is definitely one of the safest exchanges on the market, but you need to understand that you must always operate while Bingex does, OK? Super simple, super easy to
[09:44] explain, easy to understand here. If you want to consider a decline, just explaining it like that, without any analysis, right? Just thinking about it, look, it got close to 50% here, so if he were indicating it, it would be
[10:00] close to 38.2, OK? This would be our selling point, with our profit would be our selling point, with our profit at 100% and our stop loss at 0%. That's it . Trading isn't about guessing where the price will go, it's about knowing
[10:15] if you're entering a profitable zone. Fibonacci is your GPS, helping you not get lost on your way to finding the profitable zone. That's right finding the profitable zone. That's right . And the GPS is that 50%. Anything
[10:27] above 50% is expensive, anything below 50% is cheap. Just by doing that, you'll already find better places to shop, right? Remember that it needs to be consistent with other indicators or regions that you have already studied.
[10:42] regions that you have already studied. If this video simplified your life, give it a like and comment below if you already use Fibonacci as a GPS to use Fibonacci as a GPS to find the best zones.
[10:54] Comment below if you've ever used Fibonacci as a GPS, and also subscribe to our channel and don't forget to check out this video here. check out this video here. Until next time.
⚡ Saved you 0h 11m reading this? Transcribe any YouTube video for free — no signup needed.