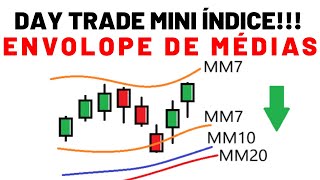

4 Moving Averages Setup for Day Trading
60sClear, concise explanation of a unique trading setup with four moving averages, appealing to traders looking for new strategies.
▶ Play Clip"Delivers a complete, actionable trading setup with clear rules and backtest stats, though the title's 'sensational' is a bit of a stretch."
This video presents a day trading strategy for the 1-minute chart of the Brazilian futures index (Mini Índice), using four arithmetic moving averages to create an envelope and determine trend direction. The strategy operates only between 4 PM and 5 PM, entering at market on candle closes beyond the envelope, with exits following the opposite envelope line. Backtest results show a 72% success rate, 918 trades, and a profit factor of 1.75.
The setup uses four arithmetic moving averages: two of 7 periods (one on highs, one on lows) to form an envelope, and two of 10 and 20 periods on closing prices to determine trend direction.
The strategy only works from 4 PM to 5 PM on the 1-minute chart of the futures index, capturing a small time window near the end of the trading session.
A sell signal occurs when a candle closes above the upper line (average of 7 highs) while the 10-period moving average is below the 20-period moving average. Entry is at market on the next candle open.
For sell trades, the exit order is placed at the lower line (average of 7 lows) and follows its value as it moves. A stop loss of at least 150 points is recommended to avoid being stopped out by shadows.
A buy signal occurs when a candle closes below the lower line (average of 7 lows) while the 10-period moving average is above the 20-period moving average. Entry is at market on the next candle open.
For buy trades, the exit order follows the upper line (average of 7 highs). The trade is closed when the price reaches that target.
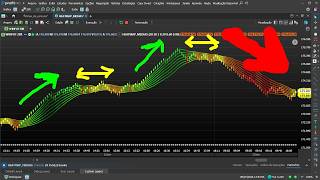
A color-coding system can be created to easily identify buy or sell signals, making the strategy easier to follow.
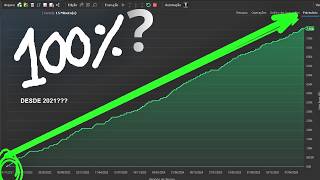
Backtest from January 7, 2025 shows an upward-sloping capital curve with a 72% success rate, 918 trades, profit factor of 1.75, payoff of 0.60, and a drawdown of 6.65.
This strategy offers a systematic approach to day trading the Mini Index using moving averages, with strong backtest performance. Traders are encouraged to test the setup themselves and draw their own conclusions.
What are the four moving averages used in this setup?
Two 7-period arithmetic averages (one on highs, one on lows) and two arithmetic averages on closing prices: 10-period and 20-period.
00:18
What is the trading window for this strategy?
Only from 4 PM to 5 PM on the 1-minute chart of the futures index.
01:31
What conditions trigger a sell signal?
The 10-period moving average must be below the 20-period moving average, and a candle must close above the upper line (average of 7 highs).
02:53
What conditions trigger a buy signal?
The 10-period moving average must be above the 20-period moving average, and a candle must close below the lower line (average of 7 lows).
05:32
How is the exit order placed for a sell trade?
The exit order is placed at the lower line (average of 7 lows) and follows its value as it moves.
03:47
What is the recommended minimum stop loss distance?
At least 150 points, to avoid being stopped out by shadows.
04:15
What were the backtest results?
72% success rate, 918 trades, profit factor of 1.75, payoff of 0.60, and a drawdown of 6.65.
12:17
Four Moving Average Envelope Setup
Provides a clear, rule-based framework using only moving averages, making it accessible to traders.
00:18Restricted Trading Window
Limiting trading to a specific hour reduces noise and focuses on a predictable market phase.
01:31Trailing Exit with Envelope
Using the envelope line as a trailing stop allows profits to run while protecting gains.
03:47Backtest Statistics
Provides concrete performance metrics (72% win rate, profit factor 1.75) that validate the strategy's potential.
12:17[00:18] video on the channel. And today I want to share with you a setup for the one-minute chart of the futures index. This setup works with the moving average envelope. We're going to use two moving averages here to create this envelope, and
[00:33] we're going to use two other moving averages to determine the direction of the trend, whether it's buying or selling. The two moving averages that we use to create an envelope are two moving averages of seven. An average of seven highs and
[00:47] another average of seven lows. The one at the top here, in orange, is an average of seven highs, and the one at the bottom here is an average of seven lows. They are arithmetic. We're not using exponential moving averages here, okay? These are
[01:02] arithmetic means. And we're also going to use the average of 10 closings and the average of 20 closings. These are the two averages arithmetic. We're going to use these two moving averages of 10 and 20 closing prices
[01:18] to determine the trend, whether we 're in an uptrend or a downtrend, okay? So these are the four averages that we're going to use. We're going to use a time interval here so we can perform
[01:31] our operations. This setup only works from 4 PM to 5 PM on the 1-minute chart of the futures index. So he's only going to capture a small time window near the end of the trading session, from 4
[01:47] PM to 5 PM, right? our strategy work here? Let's go. We will be working with market entry orders . It's either buying at market or selling at
[01:59] market. And I'm going to show you an example of a sale here so you can begin to understand the strategy. Let's go. You can see that this candle here, go. You can see that this candle here, look, it was a 4.18 candle.
[02:12] So he was already within the strategy's operating hours, which range from 4 to 5 am. It was within those operating hours, and you notice that its closing time was higher, it was higher
[02:28] than the average of the peaks, the average of the seven peaks. Notice that the average of the seven maximums, it was passing here, look. See? And where did the candle close See? And where did the candle close ? He was here. Can you see?
[02:41] So, in this case, we had a candle closing price higher than the average of the seven highs, higher than the upper line. He understands? At the moment
[02:53] upper line. He understands? At the moment when we have this, and along with when we have this, and along with that we also have the 10-period moving average lower than the 20-period moving average, then we have a sell signal, right? The
[03:06] key here is to always pay attention to whether the average of 10 is below the attention to whether the average of 10 is below the average of 20, right? Because if the average of 10 is below the average of 20, then we have a selling trend.
[03:20] When this candle closes above the upper line, we above the upper line, we have confirmation of the sell signal, and we will enter the market
[03:33] at the opening of the next candle. in the sale, as happened here. Entering the market here, we're going to place our exit order at the place our exit order at the lower line, which is right here, at the average of the
[03:47] seven lows. And we're going to monitor the average price of the seven lowest prices. Our order will follow the value of that lower line. Wherever that bottom line goes, our order follows.
[04:01] So, if the price starts to break away and rise, we'll use this lower line here to move our exit order higher. Yes, you can place a stop loss here in the trade. It can't be a very short stop. You
[04:15] would need to place a stop-loss order of at least 150 points there, at a minimum, so that it doesn't get too close to the price and hinder its movement. This setup aims to take advantage of shadows. So, if we set a
[04:30] very short stop loss, it won't make sense, because it will stop the trade unnecessarily, okay? So, in this case, I didn't even set a stop-loss order to show As you can see here, the capital curve is upward sloping. We're
[04:43] simply working with the output on the bottom line, in this case, the sale. So, look, he hit the bottom line here and closed it out here, okay? to function in this way. When buying, it's the opposite. It's the opposite. Here you have
[04:59] the opposite. It's the opposite. Here you have the green line. This green line here is the average of 10 closing prices. And that yellow line is the 20-period moving average. Whenever you have the green line
[05:16] above the yellow line, that is, the 10-period moving average above the 20-period moving average, then you 're in an uptrend. You have a scenario set up for a purchase, and all you need to do is save the buy signal. An average of 10 is above an average of 20.
[05:32] We're in a buying scenario. When is the right time to make a purchase? The right time time to make a purchase? The right time to buy is when the candle closes below the lower line, which is the average
[05:45] of the seven lows. And that's what this candle here did. He closed it down. Look here, it closed below the lower line that was passing by here, which is the average of the seven lows, okay? He closed it down.
[06:00] So, we had confirmation of the closes here, we're going to enter the market. We will enter the market at the opening of
[06:13] this next candle. And we're going to exit the operation in the following way. The exit order will follow the top line; it's the reverse of a sell order. It's going to follow the top line now,
[06:27] and it's off here, okay? We're ending the operation here, right? Ah, we'll continue waiting for more buy signals, because the 10-period moving average is above the 20-period moving average. So we have to wait for other
[06:43] buy signals unless the 10-period moving average moves below the 20-period moving average, which would then give us a sell scenario. So here we had another purchase transaction taking place. Why? Because you had here, the 10-period moving average
[06:58] Because you had here, the 10-period moving average above the 20-period moving average. The closing price of this candle here was slightly lower than the lower line. It doesn't lower than the lower line. It doesn't matter, it can be five points, okay? So
[07:11] for us, if it manages to close below the average of the seven lows, it has already satisfied the condition and we enter a market buy position at the opening of the next candle, right? It makes it even easier to create a color-coding rule, right?
[07:26] You can create a color-coding system that makes it easier for you to identify buy or sell signals. So, look, it closed below the lower line, which is the average of the seven lows. We enter a
[07:38] market buy order, and at the opening of the next candle, our exit order will be placed here, at the average of the seven highs. The moment we reach that target, we'll shut down the operation, just like what happened here, right? Just a
[07:51] reminder that it will only operate until 5 PM, right? Only until 5 until 5 PM, right? Only until 5 pm. Look, here it is again. Let's see if you understood. The 10-period moving average is above the 20-period moving average.
[08:06] If the 10-period moving average is above the 20-period moving average, then we have a buy or sell scenario. It's a buying scenario where the average of 10 is above the average of 20. The average of 10 is lower than the average of 20, okay? So,
[08:21] we have a buying scenario set up here, and you can see that this candle close, this candle close here, was lower than the lower line. So, we
[08:36] than the lower line. So, we had a buy signal here. Buy signal here! The closing price of this candle was lower than the lower line. So, with the next candle, we enter a market buy position.
[08:50] We enter here and our exit order will follow the price of the The price will match that of the higher-end line. He went there and achieved it. Oh, we higher-end line. He went there and achieved it. Oh, we exited the operation here again,
[09:03] taking advantage of these market consolidation movements. And here you are already at 4:55 PM, right? 4:55
[09:15] here, look, it's 456. There's still time, right? Because you had the signal happening here again. The signal happened again here. The 10-period moving average is above the 20-period moving average, and the candle's closing price was lower than the
[09:31] lower line. That's because it's the average of the seven minimum temperatures. So, we're going to buy at market price. We're entering the market buying phase here. Our order of departure will follow the average of the seven highs.
[09:45] Everything here is calculated using the arithmetic mean, okay? It's all an arithmetic mean. Here, look. We're leaving here, okay? And that was the end of it. It's over now because we're here, look, it's 4:59, there's no time to log in anymore. This setup will only work during a 1-
[10:00] hour interval, which is between 4 PM and 5 PM. Here are some more examples of operations. Look, we had this transaction happening here because the purchase conditions were met . So we went in here,
[10:14] we came out here, then it happened again , look, we went in here, we came out here with a profit, right? Here again, look, there was this candle here, it closed below the lower line, satisfying the buying conditions.
[10:30] So, we went in, we came out here, and again you had a sales transaction here, look, a sales transaction. Let's put this here so we can see how this sale operation went. And why did we get involved in the sale?
[10:43] We entered the sale here because, first of all, it was within the pm to 5 pm on the 1-minute future timeline. Then you had the average of 10 below the average of 20. The average of 10 below the average of 20.
[11:01] the average of 20, then we'll consider it a sales scenario. And then the confirmation for us to enter a market sell order is when the market sell order is when the candle closes above the upper line. And that's what
[11:14] closing price of this candle was above the upper line. So we enter a market sell position with a target at the lower price point. A target on the bottom line. And the target was hit here. See?
[11:30] That way. Let's take a look here. Another operation here, look, again. Look how interesting this is, how this operation happened.
[11:49] 10-point arrow below the 20-point moving average indicates a sell scenario; the candle closed above the upper line. So, confirmation of the sale, the entry into the sale happens at market price at the opening of the candle. So, we entered the sell order with
[12:04] the target at the bottom line, it went there and hit the target, right? This is the capital curve for the strategy right here. We've been running a backtest here since January 7, 2025. Here you have an upward-sloping capital curve on the 1-
[12:17] minute chart of the futures index. It's an excellent capital curve. We had a 72% success rate here, 918 trades, a profit factor of 1.75 of 1.75 with a payoff of 0.60.
[12:32] Let's take a look here. We had a drawdown of 6.65. So those are great statistics. Now let's look at the operations here. You can pause the video and observe the operations here in the backtest. A very
[12:47] this with you so you can do your own tests, okay? Do your own conclusions. I'm sharing here a study, a strategy that I identified in backtesting that had excellent results.
[13:03] research and draw your own conclusions. Draw your own video. Receive the channel's various strategies. There are dozens of open-source codes that you can use freely in your profit
[13:17] chart. Enroll today and receive, in addition to various setups, complete training teaching you step-by-step how to create strategies in the Profit Chart editor. And best of all, when you enroll, you get access to
[13:31] our support group, where we share various codes and create several strategies based on your feedback. Do you need to program a setup and don't know how? Through our support service, we
[13:44] create the code for you. Enroll today and get access to all of this right away . We share the setups with 100% open source code. You can request as many codes as you like throughout the two months of support. You
[14:00] will learn from scratch how to set up various trading systems and obtain statistics to discover winning strategies. A training program designed to teach traders to be more than just ordinary investors; they should
[14:12] develop new strategies for the stock market.
[14:27] [Applause] [Music] [Applause] [Music]


⚡ Saved you 0h 14m reading this? Transcribe any YouTube video for free — no signup needed.