
Top-Down Analysis: The 3 Time Frames You Need
42sThis segment clearly explains the core concept of top-down analysis with a simple three-timeframe framework, making it highly educational and shareable for traders.
▶ Play Clip"Solid content that delivers on the title with a clear, practical top-down strategy, though it includes a sponsor segment and some repetition."
This video presents a practical top-down trading strategy that combines multiple time frames with price action, smart money, and ICT concepts. The goal is to help traders identify market direction, key supply and demand zones, liquidity, and entry models from higher to lower time frames, ultimately filtering out low-quality setups and focusing on high-probability trades.
Top-down analysis involves studying price action across different time frames, starting from higher to lower ones. This approach helps traders understand the bigger picture first, then zoom in for precise, high-probability trade setups.
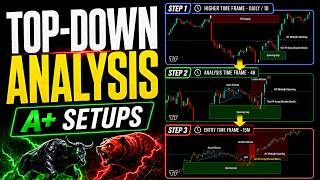
There are three key time frames: the higher time frame (for direction), the analysis time frame (for planning and bias), and the entry time frame (for confirmation and execution). Each serves a distinct purpose in the trading process.
Start with the daily or weekly chart to identify the dominant trend (uptrend, downtrend, or range-bound) and highlight key supply and demand zones. These levels are critical because the market is fractal, and reactions on higher time frames can lead to larger moves on lower time frames.
Determine whether buyers or sellers are in control by looking at the most recent price origin. If price reacts from a fresh unmitigated supply zone in a downtrend, supply is in control. Control shifts when price reaches a fresh demand zone and reacts strongly to the upside.
Zoom into the 4-hour, 1-hour, or 15-minute chart to map market structure. These mid-range time frames produce less noise than lower time frames, making data more reliable. Identify major highs and lows, breaks of structure, and potential market structure shifts.
After mapping structure, identify key points of interest (POIs) such as fair value gaps, order blocks, breaker blocks, mitigation blocks, or IFVGs. These are areas where price may react and respect.
Use lower time frames (15-minute, 5-minute, or 1-minute) for entry. Zoom in to look for price reaching the analysis time frame's area of interest, showing rejection, and forming a market structure shift or change of character. Then identify an entry model (e.g., FVG, order block) and execute.
If using the 4-hour chart as analysis, use the 15-minute chart for entry. If using the 1-hour chart, use the 5-minute or 1-minute chart. The analysis time frame should always be at least twice as high as the entry time frame.
On the 4-hour chart, an unmitigated bearish order block was identified. Price tapped into it, rejected, and formed a market structure shift on the 15-minute chart. A bearish order block inside the 4-hour block provided the entry, targeting sell-side liquidity with a 6:1 risk-to-reward ratio. The trade hit take profit as expected.
The video demonstrates that combining multi-time frame analysis with a clear roadmap can make trading more informed and simpler. By following a structured top-down approach, traders can increase the probability of success and avoid low-quality setups.
What is top-down analysis in trading?
Studying price action across different time frames, starting from higher to lower ones, to understand the bigger picture first and then zoom in for precise setups.
00:56
What are the three key time frames in top-down analysis?
Higher time frame (direction), analysis time frame (planning and bias), and entry time frame (confirmation and execution).
01:24
Why is the market considered fractal?
Price patterns and reactions repeat across different time frames, so a small reaction on a higher time frame can lead to a much bigger movement on lower time frames.
03:11
How do you determine who is in control (buyers or sellers)?
By looking at the most recent price origin and how price reacts to fresh unmitigated supply and demand zones. If price reacts from a fresh supply zone in a downtrend, supply is in control.
03:52
What is a bearish order block?
The last up-close candle or series of up-close candles formed before a strong bearish move that causes a break of structure.
07:32
What is the rule for selecting the entry time frame relative to the analysis time frame?
The analysis time frame should always be at least twice as high as the entry time frame. For example, 4-hour analysis with 15-minute entry, or 1-hour with 5-minute or 1-minute.
10:16
What confirmation is needed on the entry time frame before executing a trade?
Price should tap into the higher time frame zone, reject, and form a market structure shift or change of character.
10:56
Market is Fractal
Explains why higher time frame reactions can lead to larger moves on lower time frames, a core principle of multi-time frame analysis.
03:11Higher Time Frame Zones Have Priority
Emphasizes that fresh unmitigated higher time frame zones override lower time frame signals, preventing traders from taking counter-trend trades.
04:35Mid-Range Time Frames Reduce Noise
Highlights why 4-hour and 1-hour charts are more reliable for structure mapping than lower time frames, improving data quality.
05:33Time Frame Ratio Rule
Provides a concrete guideline (analysis at least 2x entry) that traders can apply to any market, making the strategy actionable.
10:166:1 Risk-to-Reward Example
Demonstrates a real trade with a high risk-to-reward ratio, showing the practical payoff of the strategy.
11:59[00:02] episode of Smart [music] Risk. In this video, I'm going to show you how to combine multiple time frames [music] in a simple and practical way, so you can analyze any chart from A to Z and find higher probability trading
[00:14] By combining price action with smart money and ICT concepts, we'll break down how to identify market direction, key supply and demand zones, liquidity, and entry [music] models from higher time frames down to lower time frames.
[00:29] By the end, you'll know how to filter out low-quality setups and focus only on trades with real A+ potential. We always appreciate [music] your support, so make sure to give this video a thumbs up. And if you're new here,
[00:41] subscribe to the channel. See you after the intro.
[00:56] started. First, what is top-down analysis? studying price action across different time frames, starting from the higher lower ones. This approach allows traders to
[01:11] understand the bigger picture first, and then zoom in to find more precise, high-probability trade setups. Now, when using top-down analysis, there are three key time frames every trader should understand.
[01:24] This is used to determine the dominant market direction. In simple terms, we want to know who is in control, buyers or sellers. The higher time frame gives us the overall trend, major structure, and
[01:38] broader market context. Number two is the analysis time frame. for planning. On this time frame, we assess market conditions, map out structure, identify key liquidity zones, and define our
[01:53] This is where we decide whether we should be looking for buys, sells, or no trade at all. Number three is the entry time frame. Once our bias is clear, the entry time frame is where we zoom in to look for
[02:06] confirmation signals and execute the trade. So, each time frame has a different purpose. The higher time frame gives us direction. The analysis time frame gives us structure and bias, and the entry time
[02:18] frame gives us confirmation and execution. Now, let's break them down time frame. Top-down analysis always starts with the higher time frame analysis. Before doing any detailed chart
[02:31] analysis, the first step is to focus on the daily or weekly time frame. broader view of the market, helping us stay aligned with the bigger picture and on the right side of price action. The first thing we need to identify is
[02:46] the current dominant trend. Is price in an uptrend, a downtrend, or a range-bound condition? This helps us understand the overall Along with that, we need to highlight
[02:58] higher time frames, especially on the daily chart. These levels act as important areas where price may react, reverse, or break through. Identifying these areas is critical
[03:11] because the market is fractal, meaning price patterns and reactions repeat across different time frames. A small reaction or shift on the daily or weekly chart can lead to a much bigger movement on the lower time
[03:23] That's why before placing any trade, we price has before reaching the next key higher time frame level. The next important part of higher time frame analysis, especially if you use
[03:37] daily or the 4-hour chart as your main higher time frame, is identifying who is in control, buyers or sellers. So, what makes this important? Identifying which side is in control is crucial because if you don't know
[03:52] whether buyers or sellers are dominating the market, there's a high chance you'll direction. To understand whether demand or supply is in control, we need to look at the most recent price origin.
[04:05] downtrend and price is reacting from a fresh unmitigated supply zone, then supply is in control. In that case, we should mainly be buys. Supply remains in control until price
[04:21] reaches a fresh demand zone and reacts strongly to the upside. At that point, demand takes control and we should stop looking for sell setups, even if what looks like a perfect short entry appears on the lower time frame.
[04:35] So, identifying who is in control always depends on how price reacts to fresh unmitigated supply and demand zones. And always remember this. Higher time frame fresh zones have priority over the time frame you are
[04:49] currently analyzing. This means if price taps into a fresh unmitigated higher time frame zone from the opposite side, control can shift from demand to supply or from supply to demand.
[05:05] higher time frame analysis is to zoom into the analysis time frames, such as the 4-hour, 1-hour, or 15-minute chart. These time frames are one of the most important parts of your technical analysis because once you understand how
[05:19] to read them properly, you can avoid many common traps and make better The reason we use the 4-hour and the 1-hour or even 30-minute time frames for market structure mapping is that they are mid-range time frames.
[05:33] They don't usually produce as much noise and misleading information as the lower time frames, which makes their data more reliable and easier to understand. faster than the higher time frames, making them very useful for intraday
[05:47] analysis. So, to perform proper analysis in this step, we need to identify the market direction by focusing on the major highs and lows. This helps us determine whether price is
[05:59] in an uptrend, a downtrend, or a consolidation phase. And once we understand that, we can build a much more precise intraday bias. After identifying the overall direction and the major structural swing points on
[06:12] the next step is to mark any breaks of structure, and then look for potential market structure shifts or changes of character. Once the market structure mapping is complete, we then need to identify key
[06:24] time frame. These are areas where price has the potential to react and respect. But before we continue, if you're looking for a trusted prop firm with fast and reliable payouts,
[06:37] then you need to check out FundedNext. FundedNext is one of the pioneer prop firms that offers both futures accounts and CFDs all in one place, which gives traders a lot more flexibility. They provide a wide range of challenge
[06:50] accounts starting from $5,000 all the way up to $200,000. They also offer start trading without going through a challenge phase. And for the smart risk community, you can get an exclusive 7% discount plus a
[07:05] 120% account reward, which is only available through our link. Check out the link in the description. A point of interest can be a fair value gap, an order block, a breaker block, or
[07:18] a mitigation block, or an IFVG. For example, on this 4-hour euro dollar chart, the most recent bearish BOS is located right here. At the origin of the bearish move that caused this break of structure, we also
[07:32] have a strong inefficiency. This gives us an order block. A bearish order block is the last up close candle or series of up close candles formed before a strong bearish move that causes a break of structure.
[07:46] So, here, I'm going to highlight these two up-close candles as my order block. This gives us a fresh supply zone, and this is exactly where we want to keep our eyes because it can be an ideal area to look for short opportunities if price
[08:00] pulls back into it. Now, after completing these steps on the analysis time frame, you should have a clear understanding of market sentiment next. At this stage, we start looking for the
[08:14] actual entry point. This is where the entry time frames, such as the 15-minute, 5-minute, or 1-minute chart, come into play depends on the analysis time frame. Here, we zoom in even closer to look for
[08:26] the trade. The main reason we use lower time frames for execution is simple. They give us a clearer view of price action and allow us to enter with a better risk-to-reward ratio on the micro
[08:40] Now, first things first. After zooming into the entry time frame, our analysis time frame's area of interest and show signs of rejection.
[08:52] step is to look for a market structure shift or a change of character. confirmed, the next step is to identify an entry model. This could be a fair value gap, an order block, a breaker block, a mitigation
[09:07] block, or an inversion fair value gap entry model. Which one you focus on depends on your trading model and personal preference. entry models in our previous videos, so
[09:20] find the links in the description for a more detailed explanation. And finally, after identifying the entry model and entry zone on the entry time frame, we can use it to open a position and execute our order.
[09:34] The entry time frame can also add extra confluence and confirmation to our trading setup, helping increase its probability of success. You can strengthen the setup even more by looking for VSR patterns, double
[09:47] sweep confirmation, or by using tools like volume profile indicator on the entry timeframe. Now, in terms of timeframe selection, if you use the 4-hour chart as your analysis timeframe, I recommend using
[10:01] timeframe. If you use the 1-hour chart for your 5-minute or 1-minute chart for your entry. your analysis timeframe, then it's better to use the 1-minute chart for
[10:16] But keep in mind, your analysis timeframe should always be at least twice as high as your entry timeframe. Now, in this example, since I'm using the 4-hour chart as my analysis timeframe, I'll use the 15-minute chart
[10:31] as my entry timeframe. So here, on the Euro dollar 4-hour timeframe, we have an unmitigated bearish order block. This gives us an ideal area to look for short opportunities if price taps into
[10:43] it and shows rejection on the 15-minute timeframe. At this point, I zoom into the 15-minute chart to monitor price action more closely and wait for confirmation. What we want to see is simple.
[10:56] Price should tap into the 4-hour order block, reject from that area, and then create a market structure shift on the 15-minute chart. Now, as you can see, after tapping into the higher timeframe supply zone, price
[11:09] reversed and formed a clear market structure shift. This shows that buying momentum is fading and sellers are taking control again. So our 15-minute bias turns bearish, and
[11:21] opportunities. Now, if you look closely, we also have a bearish order block inside the 4-hour order block. This 15-minute order block was formed at the origin of the market structure shift
[11:34] move, and it is created by these two up-close candles. So now, we have the 15-minute entry area we were waiting for. With these confirmations in place, we can anticipate price to retrace back
[11:46] into the 15-minute order block before continuing lower toward the sell-side So here's my plan. I'm setting my entry at the lowest point just a couple of pips above the higher high.
[11:59] For the take profit, I'm targeting the sell-side liquidity below this swing low, which gives us roughly a 6:1 risk-to-reward ratio. this trade unfolds. As you can see, the order was triggered.
[12:14] After a brief drawdown, price reversed, pushed lower, and eventually hit the pushed lower, and eventually hit the take profit exactly as expected. This shows how combining multi-time frame analysis with a clear roadmap can
[12:26] make your trades more informed and your trading process much simpler. Thanks for watching. I hope you found this video valuable. If you did, hit subscribe and turn on notifications so you never miss an
[12:40] thoughts or topics you'd like to see next. Your support means the world to next. Your support means the world to us. See you in the next video.
⚡ Saved you 0h 12m reading this? Transcribe any YouTube video for free — no signup needed.