
Why Double Tops Fail in Classical TA
45sChallenges common trading wisdom, sparking curiosity and debate among traders.
▶ Play Clip"Delivers on the promise of an institutional perspective, but the heavy promotion of the Telegram channel and repetitive examples pad the runtime."
This video explains the double top and double bottom chart patterns from an institutional perspective, arguing that classical technical analysis alone is insufficient. The presenter demonstrates how smart capital uses these patterns as traps for retail traders, and provides a more effective framework that incorporates context, liquidity, and divergence.
The video discusses double top and double bottom patterns, explaining why they underperform in classical technical analysis and how to analyze them from an institutional perspective.
The presenter encourages viewers to subscribe to his Telegram channel for trading analytics and market thoughts.
Classical patterns only work in the right context. Reading many books on technical analysis doesn't help because they don't cover context, leading to positions based on chance.
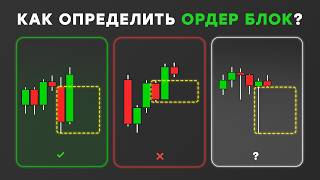
A full-fledged setup requires a bearish order block at premium prices from a resistance zone with divergence (classic or hidden). Confirmation is a break of the market structure (MSB), allowing a conservative entry.
The method is repeatable because it follows logic and patterns, unlike most trades. Trading 1-2 positions a week is enough for high-probability profitability.
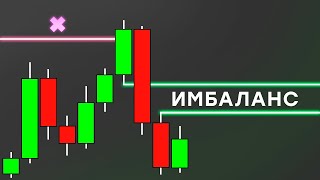
Retail traders see a double top and short, placing stops above equal highs. Institutions see a magnet of liquidity (inefficient pricing) above, leading to two scenarios: upward movement to trigger stops and cover imbalance, then downtrend; or a rollback to support and then upward to cover imbalance.
After filling the imbalance and testing the first resistance zone, the downtrend continues. Retail traders ignore context, leading to early and unsubstantiated positions.
Dozens of patterns form daily, but most are in the wrong context and act as liquidity for smart capital. Backtesting for at least ten hours can help.
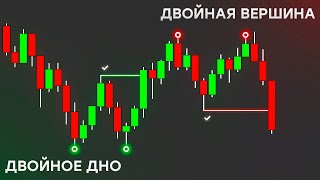
Double bottom is a bullish pattern that provokes retail to long. Similar to double top, it forms in a range of inefficient pricing, with an uncovered imbalance that will cause a return lower to continue the uptrend.
The price tests the bearish order block, then moves to the first support zone of semi-liquidity. The order is formed to fill smart capital's buys before the true zone of interest. Downward movement to cover imbalance may be slow, pulling up liquidity with buy stops.
The upward trend continues due to trend liquidity behind each high of the internal structure (stop losses for buys).
A full setup in the short after testing a breaker. Stops behind highs are used as targets.
A double top forms in a sideways range after a downward impulse. Retail shorts with stops above highs, but the price is expected to move up to liquidity. The target is measured by projecting the range from the low to the high upward.
Bearish divergence at highs makes traders sell, acting as liquidity for the algorithm.
Double tops on 4H with clear bearish divergence. Retail sells, stops above highs. Algorithm returns to support zone and continues upward due to trend liquidity and equal highs.
Price reaches the measured target, then a deep correction begins. Price movement is driven by liquidity on one side, not just buyers/sellers.
Measure distance between low and high, project above for target. Price reaches target and reverses. Previous deep correction had similar accumulation and trend liquidity.
Two examples show obvious double tops. The logic is repeatable; traders should look for setups based on evaluation, not guessing.
On the same chart, two double bottoms form. Retail buys with stops below lows. After price reaches target, liquidity is absorbed (e.g., $3 billion stop loss collected).
Wait for price to reach target, then open a long position for a retest. Measure distance from high to low and project below for target.
Algorithms rely on levels; sellers and buyers have nothing to do with final price. The method is verifiable on any chart.
The presenter shows another example where a double top led to a target, then a double bottom formed. He opened a short at the top (check Telegram).
Classical technical analysis works, but only in the right context. Conduct backtests to verify effectiveness.
The video concludes that double top and double bottom patterns are effective only when combined with institutional concepts like order blocks, divergence, and liquidity. Traders should focus on context and backtesting rather than trading every pattern.
What is the main reason classical double top/bottom patterns often fail?
They are applied without considering the institutional context, such as order blocks, divergence, and liquidity.
00:42
What factors are needed for a high-probability double top setup?
A bearish order block at premium prices from a resistance zone with divergence (classic or hidden), and confirmation via a break of market structure (MSB).
01:24
What is the role of equal highs in a double top from an institutional perspective?
They act as a magnet for price because stop-losses for buys are placed above them, creating liquidity.
03:06
What is the typical outcome after a double top forms and the imbalance is filled?
The price often continues the downward trend after testing the first resistance zone.
03:45
How can you determine a target for a double top pattern?
Measure the distance from the low to the high of the pattern and project it upward from the breakout point.
07:37
What is the significance of a bearish divergence in a double top?
It encourages traders to sell, providing liquidity for smart capital.
08:30
What is the main driver of price movement according to the video?
The presence of liquidity on one side of the market, not just buyers or sellers.
09:35
What is the recommended frequency of trading for high-quality setups?
1-2 positions a week is enough because they are profitable with high probability.
02:16
What is the purpose of backtesting?
To verify the effectiveness of the pattern and the method.
13:49
Full Setup for Double Top
Provides a concrete, actionable checklist for trading double tops, moving beyond classical pattern recognition.
01:24Institutional View of Double Top
Explains how smart capital uses retail stop-losses as liquidity, a key insight for understanding market manipulation.
02:41Liquidity Drives Price
Challenges the common belief that price moves solely due to buyers and sellers, emphasizing the role of liquidity.
09:35Cause and Effect in Price Movement
Demonstrates that price targets are often based on measured moves and liquidity, not random chance.
12:06Classical TA Works in Context
Summarizes the core message: patterns are valid only when combined with institutional context.
13:36[00:02] In this video, we'll look at the double bottom and double top patterns. I'll explain why they won't show high performance if applied from the perspective of classical technical analysis. As in the previous video, we'll analyze this
[00:15] formation from an institutional perspective. In fact, smart capital forms traps for inexperienced and informed traders. There will be several schemes here so you can understand the main idea, and then we'll move on to
[00:28] recommend subscribing to my Telegram channel. Here I write about trading analytics and thoughts on the market. You'll find a lot of useful and interesting information for yourself as a trader. Follow the link in the description below the
[00:42] video. I won't show you how to trade using the classical method. This information is already freely available, but you don't need the funds to work. Such patterns, like effectively, but only in the right context. When you've read a dozen
[00:57] books on technical analysis, it hasn't brought you anything because they don't besides the pattern itself. This is the main problem, why most people can't. Opening a high-quality position and their profitability at the moment depends purely on
[01:11] chance. In most situations that you will see a double top will form either from an institutional support zone or just in the air. But I will still tell you now how this pattern can be effectively applied.
[01:24] In addition to the picture itself in the form of two tops, you need to take into account a couple more factors in the diagram. A full-fledged setup that will work out 9 out of 10 times. The pattern should form a pony bearish Rudolph at premium prices from the resistance zone with
[01:37] divergence. It is desirable with a classic one, but hidden can also be used. The probability of working out may be lower. Miner Boss is a breakdown of the soup structure. This will act as confirmation of your setup,
[01:50] which will provide an opportunity for a conservative entry. This is not the only option that can be used. One of it is the most effective, it has the highest working out, and I don’t want you to believe me.
[02:03] Just open the chart and check, taking into account absolutely every factor that really works. This is an extremely high probability. I agree that such a combination of factors does not form every day, but this is exactly what you should do.
[02:16] If you want to systematically open high-quality trades, you don't need to trade every day. 1-2 positions a week is enough because they will be profitable with a high probability. The most important factor is that you
[02:28] can repeat this, unlike the trades you open in most cases, because they follow a logic and certain patterns. Here's what happens: in most cases, the price will form a double top, and
[02:41] traders, based on this pattern, begin to open short trades. Most will set stop-losses above these. This is a certain zone and resistance, but from an institutional perspective, this pattern
[02:54] will be viewed completely differently, like any other. The first thing you need to pay attention to is equal maximums. There will definitely be a stop-loss for buying above them. Ineffective pricing, which
[03:06] acts as a magnet for the price, will also be higher. Therefore, there will be two possible developments. The first option will be an upward movement from the current values, activating stop-losses that are above x and y, and
[03:19] covering the balance, after which the downward trend will continue. The second option is a rollback of the first support zone and the beginning of an upward movement in order to cover the imbalance, and then a downward trend. This pattern will continue to be
[03:32] quite common. At these moments, obvious manipulation occurs, and it is most likely that this pricing is what prompts you to open a hasty, unprofitable position. The most common option
[03:45] you will encounter after filling the imbalance and testing the first resistance zone is shown here. The downward trend continued, the reason why the average trader doesn't pay attention to such obvious things is the main reason for opening
[03:58] early and unsubstantiated positions. First, pay attention to the context in which any pattern is formed and then make any decisions about opening a position. Dozens of patterns will appear on any pebble
[04:10] per day, but this doesn't mean that they all need to be traded. Most of them are formed in the wrong context, which I'm talking about. This is done to encourage non-traders to open trades, thereby acting as
[04:22] liquidity for smart capital in the future. Of course, it won't be as simple as drawing a triangle, but in any case, it's quite easy if you devote at least ten hours to a backtest. Okay, let's move on to the double bottom. This is a bullish
[04:35] pattern that provokes the universe of retail traders to open a long position. By analogy with the double top, you can pause and conduct a simple analysis. We'll also draw up a trading plan in this range. So, here
[04:48] traders open trades in the direction of the trend and leave their protective stop losses for sale for equal amounts because they perceive them as support zoom, but we see that This potential eagle, according to its structure, was formed in a range of
[05:01] ineffective pricing. It is likely that there was a support zone on a lower timeframe, which was the reason for such a reaction. The price is moving toward the first resistance zone below. An uncovered imbalance remains and equals
[05:13] silt. This is the reason why the price will return lower in order to continue the upward trend. Looking at this diagram, everything becomes quite simple, although many more factors can be taken into account to increase the likelihood of your
[05:26] assumption being realized. Here, everything is quite variable. The price tests the bearish mushroom, after which it will begin to move toward the first support zone of the allocated semi-liquidity. The order was formed to fill
[05:39] exactly the purchase of smart capital before the true zone of interest. Most likely, the downward movement to cover the imbalance will be quite slow form pull-up liquidity with buy stops. This will cause a
[05:54] future asset premium. This is the option that you will most often encounter after filling the imbalance and testing the first support zone in a discounter. The upward trend continued. The reason for the impulse growth will be the
[06:08] trend liquidity behind each high of the internal structure. There are stop losses for buying, the growth itself is already a logical consequence, okay, now I will show you using real examples how you can work
[06:20] with a double top, after that we will analyze the double bottom on the chart. I found two examples and based on them you could make any assumptions. Let's start with the first one, as you may remember, at the beginning of the video I explained how to trade a
[06:33] double top correctly and what factors need to be taken into account. If you find this example and compare this set of factors, you will see a full-fledged setup in the short and after testing the highlighted breaker, you could open a
[06:45] short position. In any case, it is important to take into account that behind these highs there remained stop losses of traders who opened a short position and we will use them in the future. But first, let's look at the second example. Here you see a
[06:57] downward impulse movement, after which a range was formed, and in this sideways movement you see a double top. This will be better seen if you look at the weekly timeframe. Well, here I drew lines so that you can understand what traders are doing here
[07:10] who trade just a picture without taking into account the context. He correctly opens a short position and leaves a protective stop. Loss on purchase behind these highs in this therefore, a short position with more ambitious targets than the lower boundary of
[07:25] the range should not have been opened. An upward movement was expected here. I have already shown my videos to fall on this liquidity scroll because it was liquidity scroll because it was quite obvious. Taking into account these factors,
[07:37] in order to determine targets for the future upward movement, we can change the distance from this alai to this x and then expand it upward like this and this will be our number one goal. And while retail
[07:50] traders will think that the price will continue to move lower, we will consider opening a longing position. A chorbu would have been formed here, from where it was our priority to consider the formation. From the stage for opening the deal, they are
[08:03] going locally. You can see the trend of liquidity, which was the reason for the aggressive growth. In addition, we have stops here where the equal and maximums are located. Even if the price updates this maximum and retail traders
[08:17] will still look for a short position because this is perceived by them as a resistance level. But in fact, the algorithm will use exactly the measurement that I showed and strives for this value, simultaneously provoking
[08:30] traders to open short positions and you know that there is a bearish divergence at these highs, this is exactly what makes them sell and as a result they act as liquidity. Now I want to show you how this will look on a 4-
[08:43] hour timeframe. Let's look at this range. The first thing you can pay attention to is the formation of double tops. Here is the first Schwarz stage and the second Schwarz stage. What do poorly informed traders do in these
[08:55] situations? They sell, leaving a stop loss above these A.U. and in addition, we see that we have a fairly clear bearish divergence, this will already be a good factor for most of you to open an inappropriate short position as a
[09:09] result, the algorithm returned to the support zone of video b and continued the upward movement, the reason for the growth was the trend liquidity and equal maximums, ok, let's go to the daily
[09:22] timeframe again and look at the processing, as you remember, here is the target where the algorithm will deliver the price and you see that the price came exactly to the target, after which a deep correction began, this is exactly how it works, in fact, there is
[09:35] no such thing as buyers only higher or sellers lower prices, the rise and fall of the price is ensured by the presence of liquidity on one of the sides, as I just showed, and you can find such processing not only on the
[09:48] because the market is fractal, and now we return to the first example, we do absolutely the same thing, measure the distance between this fight and this high, set this range above its target where the algorithm will deliver the price,
[10:05] now we look to the right side and you see an excellent processing, after which the price again It turned around, and if you look here at the previous deep correction, you will see absolutely the same thing that was
[10:18] here, before the growth, a trend liquidity was formed and the sideways movement has all the signs of accumulation. The price also tested this tour book and this entire liquidity, together with the liquidity above, was the reason for this
[10:31] aggressive price growth. As you can see, there are two examples of obvious double tops on the chart, and there is nothing else here. I am not trying to only showing what you can work with, and at the same time promising the logic of how
[10:46] this business is actually done. You can open trades based on this. You just need to devote enough time to this in order to simply understand and accept how renas actually function, and then you will not be
[10:59] engaged in guessing your trades, but will be looking for setups based on evaluation that work out the chain with high efficiency with safe stops and logical targets. Okay, now let's move on to examples of a
[11:11] double bottom. This is the same chart where the first deep correction began, and here you can notice two Examples in the same place, and you might wonder what the retail trader's universe is doing here. They buy and leave
[11:24] stop losses behind these layers and behind these Maya. After the price reaches its target, this liquidity is absorbed. Here, a stop loss of $3 billion was collected. situation? Wait until the price reaches its
[11:39] targets, and then open a ford position for placement for the first one, because... You could determine the nearest double bottom by measuring the distance from this x to this moon and duplicated it below. This is how
[11:53] you see that the first tag is located here. The price after removing this liquidity stops right at the level we specified. As you can see, this is not an accident and there is a cause-and-effect relationship everywhere. The algorithms relied on this
[12:06] level and sellers and buyers have nothing to do with the final price screensaver. nothing to do with the final price screensaver. only with this double bottom, measure the distance from this x to this
[12:19] moon and project it below. This is your final goal. This is The algorithm ideally delivers the price after which the upward trend will continue. This is how
[12:31] it actually works. If you doubt the performance of this method, you can simply open any chart, any timeframe, and check it. I did not choose any specific examples here. I chose the one that exists. It
[12:45] worked perfectly before and will work in the future. Let's even look at another example similar to those I just showed, just for fun. As you remember, based on this double top, the price is already I reached my target and this
[12:58] diagram shows signs of distribution at this high. I already opened a short position right at the very top. You can check this by simply going to my telegram channel and here below you can see a double one. Here is the first minimum,
[13:11] and here is the second. You measure the range from this to this Louis and project it below. This will be your primary target where the price becomes most pleasant your primary target where the price becomes most pleasant
[13:24] after which the price consolidated from it for a week and then the downward trend will continue. I think that I have shown enough for you to be convinced of the effectiveness of this concept and tushu. Classic technical analysis works, but
[13:36] only in the right context. Based on the information that I would draw certain conclusions for yourself. And of course, conduct a bts to verify the effectiveness of how the double
[13:49] top and double bottom pattern actually works. If you learned something new in this video, then like because it helps promote the video. And also, don't forget to subscribe to my telegram channel. The link is in the description. Good luck.
⚡ Saved you 0h 14m reading this? Transcribe any YouTube video for free — no signup needed.