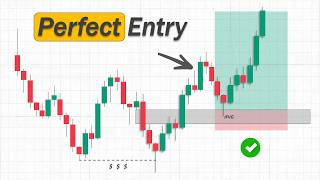

Identify Market Reversals Early
30sPromises a simple technique to spot turning points, tapping into traders' desire for an edge.
▶ Play Clip"The title promises a strategy to identify reversals early, and the video delivers a detailed method with examples."
This video teaches a smart money trading strategy to identify market reversals and trends using concepts like change of character, liquidity grabs, and fair value gaps. The presenter explains how to distinguish real reversals from false signals and demonstrates a two-timeframe approach for high-probability entries.
In a clean uptrend, price makes higher highs and higher lows. The lowest point starting a move is the protected low; as long as price stays above it, buyers are in control.
When price fails to make a new high and breaks below the previous swing low, it signals a potential reversal. This shift is called a change of character.
Three reasons for false signals: failure to continue (price breaks low but quickly recovers), liquidity grab (price briefly breaks low to trap traders), and fair value gap mitigation (price fills a gap then resumes trend).
A true reversal involves: price fails to create a new high, breaks a protected low with strong momentum, and often occurs at key levels or after trend exhaustion.
Use a higher timeframe to identify direction and key supply/demand zones. Then switch to a lower timeframe (at least 2x lower) to find reversal signals for entry.
Look for a liquidity grab (break of previous high) followed by a change of character (break of recent higher low) at a higher timeframe supply level. Enter on pullback to new supply or fair value gap.
An inversion fair value gap forming after price enters a supply level indicates strong momentum shift. Place a sell limit at the start of the zone with stop loss above.
Move stop loss below each new swing low as price moves in your favor. This locks in profits and reduces pressure, allowing large risk-to-reward trades.
Professional traders typically achieve 30-100% returns per year. Chasing unrealistic profits leads to switching strategies and losses.
The video provides a systematic reversal trading strategy using smart money concepts. It emphasizes backtesting, risk management, and realistic expectations to achieve consistent profitability.
What is a 'change of character' in market structure?
When price fails to make a new high and breaks below the previous swing low, indicating a potential trend reversal.
02:19
Name three reasons for a false change of character.
Failure to continue, liquidity grab, and fair value gap mitigation.
03:09
What is the minimum ratio between higher and lower timeframes in the strategy?
The entry timeframe should be at least two times lower than the higher timeframe.
06:22
What are the two entry types described for the reversal strategy?
Change of character with liquidity sweep, and inversion fair value gap.
08:39
How do you trail profits in this strategy?
Move stop loss below each new swing low as price moves in your favor.
10:06
What is a realistic annual return range for professional traders according to the video?
30 to 100% per year.
13:50
Change of Character Definition
Core concept for identifying potential reversals early.
02:19False Signal Filters
Helps traders avoid premature entries by recognizing invalid reversals.
03:09Two-Timeframe Approach
Combines higher timeframe context with lower timeframe precision for high-probability trades.
05:53Realistic Profit Expectations
Sets proper expectations to prevent strategy hopping and losses.
13:37[00:01] move. They come from positioning yourself at the turning points, where risk is smaller and the potential reward is much larger. But to take advantage of those moves,
[00:14] are likely to happen and where a new In this [music] video, I'll teach you a simple technique to easily identify trends and turning points so you can stay on the right side of the market.
[00:28] best reversal trading strategies to find high risk-to-reward setups some of the big moves without trading pressure. If that sounds interesting, hit the like button to support the channel and
[00:42] button to support the channel and subscribe if you're new.
[00:56] to increase our success rate. In a bullish trend, it makes more sense pullbacks. But remember, the trend is your friend until it ends. When a reversal happens after a long
[01:10] uptrend, we can expect a downtrend to follow. But how do we know a reversal is coming? What are the signs of weakness in the And how can we use those signs as a trading strategy to enter the market
[01:24] early and catch the reversal move? These are the questions we're going to answer in this video. So, make sure to watch until the end because it's full of trading tips you might not find anywhere else.
[01:38] First, let me show you some basic concepts about ideal trends and reversals. We all know that in a clean uptrend, lows. When price breaks above a previous high
[01:52] and creates a new structure, it signals trend continuation. We then mark the lowest point that started this move as our new higher low, which is also called the protected low. As long as price stays above this level,
[02:06] buyers are in control, and we should only look for buying opportunities. Once again, price breaks out and creates a new structure, and we remain bullish as long as price stays above the new protected low.
[02:19] The reason this level is important is because if price returns to it, buyers are likely to step in again to protect their positions. But what happens if price fails to make a new high and then breaks below the
[02:31] previous swing low? This shows that buyers are no longer in control, and strong selling pressure has entered the market. This shift in behavior is known as a change of character, and it can act as
[02:44] an early signal of a potential reversal. It suggests that the trend may be weakening, and a move in the opposite direction could follow. However, in imperfect trending scenarios, price can create a false
[02:57] change of character, and still continue moving higher. This often confuses traders who assume the uptrend is over and enter short positions too early. By studying many price patterns, we can
[03:09] happens not because of the trend is reversing, but due to other structural reasons in the market, which we are going to discuss now. Number one, failure to continue.
[03:25] If price breaks below the swing low, but fails to continue lower and quickly moves back up, the change of character becomes weak or invalid, especially if price then breaks back above the previous high. It confirms
[03:38] that the market is still in a bullish trend. liquidity grab. If the swing low is placed in a liquidity area, price may briefly break below it to grab liquidity and then
[03:51] This was just a false move to grab liquidity, not a real reversal, which makes the change of character invalid. Number three, fair value gap mitigation.
[04:05] If there is a fair value gap below the swing low, price may drop to fill or higher. In this case, the move down is only a reaction to fill the gap and not a real shift in structure, which invalidates
[04:20] the change of character. These are situations where we do not treat the change of character as a true reversal or place sell orders. By identifying invalid changes of character, you can filter out false
[04:33] signals and focus on stronger, more reliable reversal setups, helping you stay on the right side of the market. So far we have discussed ideal trends, imperfect trends, and fake change of character signals.
[04:48] Now, let's continue with real reversals. A true reversal is not just a single break of previous structure, but a sequence of events and a shift in behavior. First, price fails to create a new high,
[05:01] then breaks a protected low with strong This is where the control shifts from buyers to sellers. However, the best reversals don't happen randomly. They often appear at critical
[05:14] areas like a higher time frame key level or after an extended move where the trend is exhausted. Another important reversal signal is a Notice how the previous upward move
[05:27] created a fair value gap, indicating strong buying pressure. But suddenly, the momentum shifts, sellers step into the market, and the price forms a bearish gap. This sudden shift tells us that control
[05:40] is moving from buyers to sellers, increasing the probability of a reversal. Now, how do we use these concepts in This brings us to the second part of the video, which is the reversal trading
[05:53] strategy. This strategy combines multiple smart money concepts and uses two time frames. On the higher time frame, we identify the market direction and mark key areas of supply and demand where the price may
[06:07] present a trading opportunity. Then we wait for the price to enter our zone and move to a lower time frame. There, we wait for a clear reversal setup and enter the trade in the direction of the higher time frame.
[06:22] You can use any time frame combination for this strategy, but your entry time frame should be at least two times lower than the higher time frame. market. You can use it in forex, crypto, stocks,
[06:37] futures, and more. However, always remember to backtest this or any strategy you learn online many times with paper trading before risking real money. Backtesting helps you understand how the
[06:50] strategy performs and gives you more confidence when entering trades. Let me show you how this trading strategy works on the price chart. As I mentioned before, this strategy uses two time frames.
[07:03] On the higher time frame, we analyze the market structure to find the direction market structure to find the direction and key supply and demand areas. If you cannot clearly identify a trend, it's better to move to another pair
[07:16] trade. To find the direction, pay attention to To find the direction, pay attention to market structure, swing highs and lows. To mark the key supply and demand areas, identify the zones that created
[07:29] imbalance or mark the candle where three momentum candles followed. In this example, here we have a key supply area. When price taps into this level, we expect a rejection to the downside,
[07:42] opportunity. First, we wait for price to enter our trading zone. Then we zoom into a lower time frame to find an entry to go short. Never enter too early before price
[07:56] returns inside your range because the market often takes out early traders. This can result in a move in your predicted direction, but only after stopping you out. Now let's zoom into a lower time frame.
[08:10] Now on the lower time frame, we have a clear short-term uptrend. We want to look for a reversal signal and enter a short trade against the lower time frame That's why this strategy is called a reversal setup. However, even though we
[08:26] are trading against the lower time frame trend, we are still trading in line with the higher time frame direction. Here, I'd like to explain two powerful You can use either of them to enter a trade.
[08:39] The first entry type is a change of character combined with a liquidity sweep. A strong trading opportunity appears previous high followed by a clear change of character.
[08:53] The liquidity grab shows that buy-side liquidity has been taken and early buyers are trapped. Then the reversal is confirmed by the change of character where price breaks the most recent higher low and shifts
[09:06] the market structure to the downside. But keep in mind that all of this price action happens at a higher time frame supply level. So we are not just trading blindly in the lower time frame.
[09:18] After that, we can wait for a pullback to a new supply level or a fair value gap to set our short trade. The second entry type is an inversion fair value gap entry. If an inversion fair value gap forms
[09:33] after price enters a supply level, it shows a strong shift in momentum. This is a powerful reversal signal and can create some of the best trading We place a sell limit at the start of the zone and set our stop loss above it.
[09:49] For targets, you can aim for a solid 1:2 or 1:3 risk-to-reward ratio and then set your next target at the next key level ahead of price. profits, which can sometimes lead to very large risk-to-reward trades.
[10:06] Trailing profits works like this. When you enter a trade and the price moves in your favor, move your stop loss just below the new swing low. If price moves again, adjust your stop loss below the next higher low.
[10:21] This way, if price reverses and hits your stop loss, you won't lose money. It reduces pressure and helps lock in profits while keeping you in the trade for as long as the trend continues. Continue using this method, but always
[10:35] set a final target for your trade. If the price keeps moving in your favor, you can achieve large profits with minimal risk. Now, let's look at some examples on the price chart to fully apply this trading
[10:48] strategy. Here we have pound-dollar on the Here we have pound-dollar on the 15-minute chart. making higher highs and higher lows with strong breakouts to the upside.
[11:02] and only looking for buying opportunities. The latest impulsive move has created large fair value gaps, which show strong buying momentum. We mark the candle that created these
[11:15] gaps as our demand zone. If price pulls back to this area, we expect a rejection to the upside and a possible trading opportunity. First, we wait for price to enter our trading zone, then switch to the
[11:29] 1-minute chart to execute the trade. On the 1-minute chart, we can see a clear downtrend, which is simply a pullback into the higher timeframe We want to see reversal signals and rejection from this area to open a long
[11:43] However, if the price breaks below the demand zone, we take no trade. As we move forward, we can see a clear change of character. We also have an inversion fair value gap and a new bullish gap forming.
[11:58] This is exactly the type of reversal signal we were waiting for. We can place our entry at the start of the zone and set our stop loss below it. Our target is the higher timeframe supply ahead of price.
[12:12] Remember, always follow a solid risk management plan and never risk more than you are comfortable losing, keeping each trade within 1 to 3% of your capital. Now, here we have the euro dollar on the 1-hour chart.
[12:27] 1-hour chart. Let's apply BOS, chalk, chalk plus, and settings. We can see a clear downtrend. We mark the candle that created the gap as our supply zone
[12:41] and include the wick as well. Now, we wait for the price to return to this area, then move to a lower timeframe to find confirmation for a short trade. So, we switch to the 5-minute chart.
[12:54] On the 5-minute chart, the price has already made a change of character. We can see an overlapping area of an inversion fair value gap and a new bearish fair value gap forming a strong supply zone.
[13:09] This gives us a good reason to open a short trade. As the price moves forward, it drops and creates another bearish gap. open a second position with reduced risk.
[13:24] As price continues, it returns and activates our first trade. However, the second trade becomes a loss if we do not manage it properly and secure some profit. Losses are a normal part of trading, and
[13:37] even professional traders experience them regularly. What matters is having an edge that grows your account over time. Also, avoid unrealistic expectations. Professional traders typically achieve
[13:50] around 30 to 100% returns per year. Chasing unrealistic profits often leads to a cycle where you keep switching strategies after losses. This cycle of doom happens because you are aiming for results that no strategy
[14:04] can consistently deliver. So guys, I hope this video brought you some value. If it did, please hit the like button to support the channel and subscribe for more trading content. Thank you, and see you in the next
[14:18] Thank you, and see you in the next episode.



⚡ Saved you 0h 14m reading this? Transcribe any YouTube video for free — no signup needed.