
The Dark Side of Trading: How Smart Money Traps Retail
60sExposes the manipulative mechanics behind price movements, sparking curiosity and debate among retail traders.
▶ Play Clip"Delivers a solid, detailed explanation of the strategy, though it's more of an educational breakdown than a 'from zero' guide."
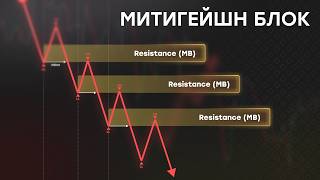
This video explains the Mitigation Block, an institutional trading concept used by smart money to revalue assets and profit from previously opened positions. It details the formation mechanics, identification rules, and trading strategies for both bearish and bullish blocks, emphasizing how retail traders' losses create liquidity for institutional gains.
A price range where traders in unprofitable positions are forced to close trades at breakeven, mitigating losses and creating fresh liquidity for the market.
Breaker relies on structure with successive highs and is a reversal pattern; Mitigation Block forms without prior liquidity withdrawal, showing a lower high (bad swing) indicating trend exhaustion.
Point A: intermediate minimum where retail buys; Point B: lower high (bad swing); Point C: aggressive decline breaking level A, trapping buyers and forcing breakeven exits.
Revaluation often occurs in cycles; each new minimum becomes the start of the next block, with retail repeatedly trapped and forced to exit, flooding the market with liquidity.
Smart money builds mitigation blocks to drive the majority into losing trades, then allows exits at retest, obtaining free volume for sale and maximizing profits on short positions.
Bearish block is the candle forming the local decline extreme, with higher highs on both sides; ideally a falling body, but if close is rising, only the shadow is the working zone.
Valid only at breakout and fixation of the breaking candle's body below the key swing; if close is higher, the formation is invalidated, even with later consolidation below.
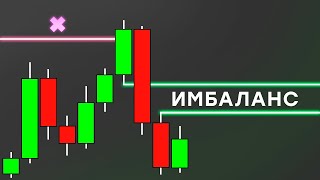
Emergence of imbalance at structural low breakout is direct evidence of smart capital activity and interest in further downward revaluation.
Entries from: start of mitigation block, full coverage of inefficiency, or start of imbalance if confirmed.
Aggressive: upper boundary of block; Conservative: beyond last structural maximum; Hybrid (most used): first step of imbalance at validation.
Limit order at full fill level; once inefficiency filled, price moves to equilibrium, eliminating repeated entry opportunities.
Justified when unwilling to miss an obvious move; mathematical expectation is more modest but probability of opening is maximum.
Price reaches institutional zone, forms final maximum, bearish order block, lower high, consolidation below key swing validates bearish block; limit sell at imbalance top, hybrid stop, target institutional support.
New mitigation block forms; profit taking in parts at semi-liquidities with proportions 30/30/40%; limit order at beginning plus 100 for swing.
Mirrored logic: point A forms when uninformed traders sell, price cannot renew extreme, point B (bad swing) leads to aggressive growth; breakout of maximum changes polarity, shorts close at breakeven, catapulting price up.
Defined by last growing candle breaking the maximum; validation requires candle body close above extreme; imbalance indicates smart money interest; entry, stop, and take mirror bearish.
Test institutional support, determine target resistance, form ABC swing, confirm with imbalance, enter long with optimized entry and stop.
The Mitigation Block is a powerful institutional tool that exploits retail traders' behavioral patterns to generate liquidity and drive price movements. Understanding its mechanics and identification rules can help traders align with smart money and improve their trading decisions.
What is a Mitigation Block?
A price range where traders in unprofitable positions are forced to close trades at breakeven, mitigating losses and creating liquidity for the market.
00:02
What is the fundamental difference between a Mitigation Block and a Breaker?
A Breaker relies on structure with successive highs and is a reversal pattern; a Mitigation Block forms without prior liquidity withdrawal, showing a lower high (bad swing).
00:43
What are the three structural points (A, B, C) in the formation of a Mitigation Block?
Point A: intermediate minimum where retail buys; Point B: lower high (bad swing); Point C: aggressive decline breaking level A.
01:42
How does smart money profit from Mitigation Blocks?
They build blocks to drive the majority into losing trades, then allow exits at retest, obtaining free volume for sale and maximizing profits on short positions.
03:19
What is the identification rule for a bearish Mitigation Block?
The candle that formed the extreme of a local decline, with higher highs on both sides; ideally a falling body, but if close is rising, only the shadow is the working zone.
04:15
When is a Mitigation Block invalidated?
If the breaking candle's body closes higher than the key swing, the formation is invalidated, even with later consolidation below.
04:31
What are the three entry levels for a trade on a Mitigation Block?
From the start of the block, from the level of complete coverage of the inefficiency, or from the start of the imbalance if confirmed.
05:13
What is the hybrid stop loss method?
Protective orders are placed for the first step of imbalance that occurs at the time of validation of the Mitigation Block.
05:41
What is the preferred entry scenario?
Place a limit order at the full fill level; once the inefficiency is filled, pricing moves to equilibrium, eliminating repeated entry opportunities.
06:09
How is profit taking distributed in the example?
Profit taking is done in parts at semi-liquidities with proportions 30%, 30%, and 40%.
07:58
What is the definition of a bullish Mitigation Block?
The last growing candle that broke the maximum from which the structural one was formed; validation requires the candle body to close above this extreme.
11:15
What is the main indicator of smart money interest in bullish appreciation?
The presence of an accompanying ordinary implied value (imbalance) is the main indicator.
11:15
Mitigation Block Definition
Provides a clear, foundational definition of the concept that the entire video builds upon.
00:02Difference from Breaker
Clarifies a common confusion between two similar patterns, which is crucial for correct identification.
00:43ABC Formation Mechanics
Breaks down the formation into three distinct structural points, making the concept easier to understand and apply.
01:42Smart Money Strategy
Reveals the underlying institutional motivation, explaining why these patterns form and how they are exploited.
03:19Imbalance as Confirmation
Highlights a key confirmation signal that indicates smart capital activity, increasing the reliability of the setup.
04:44Bullish Mirror Logic
Shows that the concept is symmetrical, allowing traders to apply the same logic in both directions.
09:24[00:02] take a closer look at the Mediation Book, an institutional tool used by smart capital to consistently revalue an asset and profit from previously opened positions. The etymology of the term accurately
[00:15] reflects its mechanics. Migration, easing, block, order zone. We are talking about a price range where traders who find themselves in unprofitable positions are forced to close their trades to breakeven. In doing so, they mitigate
[00:30] their own losses while simultaneously creating the fresh liquidity the market needs to continue moving. Visually, the Mitigation Block is often confused with a breaker. In appearance they really do look similar. An M-shaped pattern is formed on the chart
[00:43] , and after the structure is broken, the price tends to return to retest the broken swing. The fundamental difference between them lies in the mechanics of working with liquidity. The breaker always relies on a structure with successive
[00:57] renewal of highs. First, the liquidity pool is captured at the previous extremum, after which the structure breaks down. It is this fact that makes the breaker an exclusively reversal pattern. A block, on the contrary, is formed without
[01:13] prior withdrawal of liquidity. The price shows an inability to update the current extreme, forming a lower high. This losing swing indicates that the uptrend is exhausting and a reversal is imminent, as
[01:28] least resistance. In the early stages, this is often confirmed by the presence of bearish SMT divergence. The mechanics of forming a mediation block are based on three structural movements, which we will conventionally designate as
[01:42] movements, which we will conventionally designate as points A, B, and C. Point A represents an intermediate minimum, at which the retail sector actively buys in the hopes of renewing the previous maximum and continuing the trend. Point B
[01:55] marks a lower high. This is a bad swing, clearly demonstrating the weakness of buyers and the market's inability to continue rising. Point C marks an aggressive decline with an impulsive breakout of level A. As a result of these manipulations,
[02:12] market participants who bought on the upward segment between points A and B find themselves trapped in a spiral of increasing losses. The masses perceived level A as strong support, but after a breakout, its polarity changes, and now, when it is
[02:26] tested, locked-in buyers give in en masse , closing trades at breakeven, which provokes a surge in a colossal volume of sell orders. Due to this fresh liquidity, the decline not only continues, but also gains
[02:40] additional acceleration. The process of revaluing an asset is rarely limited to one formation. More often, a cascade of several cycles is built. The newly formed minimum acts as the starting point of the next stage,
[02:53] forming another lower maximum. Retail traders are buying back the asset in hopes of a revival of the uptrend , but a natural breakout of their protection level occurs. The test of the new medigаtion block
[03:06] forces the crowd to fix losses and simultaneously attracts new sellers, which literally floods the market with liquidity for sale. This cyclical nature continues until global institutional goals are achieved
[03:19] . This entire architecture is built exclusively in the interests of big capital. When in short positions, smart money does not spend its own resources on pushing the price down. They purposefully construct medication blocks, driving the
[03:34] majority into losing trades, and then allowing them to exit when the zone is retested. Thus, SmartMoney receives free volume for sale, which allows them to realize the asset's valuation and maximize profits on previously opened
[03:48] positions. Everything I discuss in my videos is not dry theory. This is a working tool that I use in practice every day, showing results in real time. Everything is in the public Telegram channel via the
[04:01] link in the description. Subscribe. Let's move on to the identification rules. A bearish Mediation block is determined by the candle that formed the extreme of a local decline. To the left and right of it there should be candles with
[04:15] higher barks. Ideally, this is a candle with a falling body, but if the close was rising, only its shadow is allocated as a working zone. exclusively at the moment of breakout and fixation of the body of the breaking candle below
[04:31] the key swing. If the close occurs higher, the formation is immediately invalidated. Even subsequent consolidation below will not return this block to its status as an institutional instrument. A strong factor in the merger
[04:44] is the emergence of an imbalance at the moment of breaking through a structural low. This serves as direct evidence of the activity of smart capital and its interest in further revaluation of the asset in a downward direction. Besides this, you
[04:58] must always consider the context. The real decline begins after a test of a significant institutional resistance zone from a higher timeframe. reaches the opposite support zone, the beginning of which will become your
[05:13] final target when setting take-profits. The opening of a transaction is considered from one of three levels: from the start of the mediation block, from the level of complete coverage of the inefficiency that has arisen, or from the start of the imbalance if it is
[05:27] confirmed. Stop loss placement is also variable. An aggressive approach involves placing it at the upper boundary of the medigation block, which requires precision and accuracy in defining the instrument. In a conservative scenario,
[05:41] the stop-loss is placed beyond the last structural maximum, ensuring maximum trade security. There is also a hybrid method, which is the most widely used in practice. Protective orders are placed for the first step of imbalance that
[05:55] occurs at the time of validation of the mediation block. The preferred entry scenario is to place a limit order at the full fill level. Once the inefficiency is filled, pricing moves to equilibrium, which completely
[06:09] eliminates the emergence of repeated entry opportunities. There are situations when the mitigation range of the block remains the Sibi range, which the price will try to cover before an aggressive assessment. In this case,
[06:22] the limit order is shifted to the beginning of the imbalance, and this ensures an optimal ratio of event rate, risk to reward, and time spent opening a position. Entering directly from the beginning of a tigation block is justified
[06:35] only in situations where you are categorically unwilling to miss an obvious move, and working based on imbalance seems inappropriate. The mathematical expectation of such transactions is more modest, but the probability of opening a transaction
[06:49] is maximum. On the chart, everything begins at the moment the price reaches a significant institutional zone of interest, capable of reversing the current trend. When the final maximum is formed, the primary signs of the emergence of a
[07:03] downward order flow appear. In this case, we see the formation of a bearish order block. After a local correction, a minimum is formed. Here, retail traders are buying aggressively, expecting continued growth. However, the price is
[07:17] unable to renew the previous high. A lower high is formed , an unsuccessful swing, from which the real fall begins. The candle body's consolidation below the key aloe vera validates the move and
[07:31] confirms the bearish medication block. A price efficiency arises within its range , at the upper limit of which a limit sell order is placed . A hybrid method of setting a stop loss for the first knot of
[07:44] the formation is used. The final target is the institutional support zone on the higher timeframe, where the position is closed completely. In this case, profit taking is carried out in parts. Intermediate levels are
[07:58] obvious semi-liquidities. The working volume is distributed among them in proportions of working volume is distributed among them in proportions of 30, 30 and 40%. The decline continues and a new mitigation block is formed. The price successfully consolidates below the previous
[08:11] last structural swing find themselves trapped and forced to mitigate their losses. When a block is retested, their mass capitulation is accompanied by the opening of new short positions, which leads to powerful selling pressure and
[08:27] pushes the price lower. The bearish imbalance has been confirmed , so the algorithm for opening a position is similar to the first situation. The limit order is placed at the beginning, 100 plus for the swing, and the takes remain the same. The price returns to the
[08:42] area of interest, gets a great reaction and forms a new, lower high. This is a clear example of how asset depreciation occurs using block mitigation. And we expect this chain to continue. The price updates the
[08:56] last pig and consolidates below it. Another imbalance has been confirmed, but its border is located too low and does not match the digation block. In classic entry method is used. The deal is opened from the beginning of the main zone
[09:10] of interest, the stop-loss is moved beyond its upper border, and the take profits remain unchanged. Rinak shows the expected reaction with a subsequent fall, until the key take is reached. Each of the three positions could be considered as a
[09:24] completely independent setup. Now you understand the basic mechanics of how smart capital works. Systematic asset valuation is a strictly controlled process of extracting liquidity from the retail sector. Smart
[09:38] money systematically capitalizes on the incompetence of the masses, using their basic behavioral patterns—fear of loss and greed—as fuel to drive prices toward their own goals. The logic of block formation is absolutely
[09:52] mirrored and is based on the same three structural points ABC. When point A forms, uninformed traders sell, expecting the downward trend to continue . However, this does not happen, and the price cannot renew the previous
[10:06] extreme decline. An unsuccessful swing is formed and point B, from which aggressive growth begins. The maximum, considered by the masses to be a strong resistance, changes its polarity after the breakdown. When it retraces, sellers, realizing that they are
[10:21] in a bear trap, frantically close their shorts at breakeven. This causes an amplified by the addition of new buyers. All this mass of liquidity
[10:33] instantly catapults the price upward. This cycle continues until a strong institutional resistance zone is reached, which can reverse the market. The main architect and beneficiary of such pricing
[10:46] is smart money, which previously accumulated its moon positions at discount prices. Their fundamental task is to ensure algorithmic delivery of prices to distribution zones, using other people's liquidity to minimize
[11:00] their own costs. The definition of a regular mitigation block occurs based on the last growing candle that broke the maximum from which the structural one was formed. Validation strictly requires the candle body to close above this extreme. The presence of an
[11:15] accompanying ordinary implied value is the main indicator of smart money's interest in further asset appreciation. They protect the range of the medication block, which ensures a high probability of reaction
[11:27] when it is tested. Entering a trade, setting a stop-loss and determining a take-profit occurs in a completely mirror image of the bearish mediation block. Now let's move on to a simple algorithm for identifying and trading a bullish
[11:40] medigation block. First, a test of the institutional support zone from a higher timeframe occurs. Next, the target for future growth is determined in the form of a reverse resistance zone. The next step is to move on to the ABC Swing Go formation,
[11:55] where the Mitigation BL is formed and implemented . Try fixing the exit of Orkhaya confirms the instrument and allows trading from it. The resulting interest of large capital and allows us to work more accurately when
[12:09] opening our long position. optimizing both the entry point and stop-loss placement. The bearish checklist is completely mirrored and is used to open a short position. This concludes our discussion. If this material helped you understand the topic and
[12:23] deepened your understanding of market mechanics, please support the video with a like and a subscription. Professional growth requires the right environment. For those committed to systemic development, our public chat is open. It is linked to the channel,
[12:37] and the link to it is in the description. Join us.
⚡ Saved you 0h 12m reading this? Transcribe any YouTube video for free — no signup needed.