
AI Summary
This trading lesson explains how to combine three Smart Money concepts — order blocks, imbalances, and structure breaks — into a high-probability entry setup. The presenter walks through the mechanics of why order blocks form, the criteria that make them valid, and shows real chart examples where the combination produces a trading opportunity.
Chapters
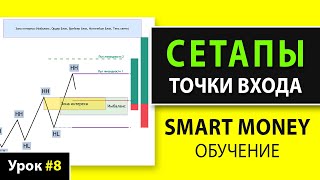
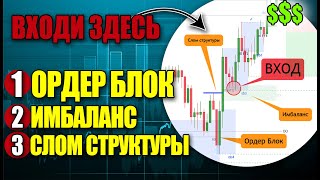
The strategy combines an order block, a structure break, and an imbalance. When all three align, it creates a high-probability entry point.
An order block is only meaningful if it removes significant liquidity. Liquidity from higher timeframes (e.g., 4-hour highs, equal highs) is more significant than recent small pools.
The more impulsive the absorption after a liquidity sweep, the better. If the price lingers or overlaps after the sweep, the block is probably not backed by a major player and should be skipped.
An order block works because a large player absorbs stop-losses during the sweep and fills a large position. The resulting impulse shows the block is an area of professional interest.
Large capital opens a false position to sweep liquidity, then needs to bring price back to close that position near zero. This is the mechanical reason price revisits the order block.
A structure break is a violation of the last structural swing of the trend. It signals that the dominating party has lost control and stops of the previous trend have been removed.
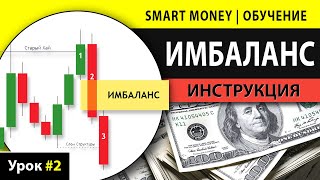
An imbalance is the emptiness inside candles: three candles where the first and third do not touch or intersect. It forms when one party pushes price with no counteroffer, leaving a liquidity gap.
A setup is worthless without defined targets. Entries are strongest when there is cascading liquidity (many pools) ahead, so there is a reason for price to continue in the expected direction.
A shadow breaking the swing is not enough. The candle should firmly close beyond the key swing; an impulsive, body-fixed break is far more reliable.
The ideal imbalance is inside the order block or on its border. Imbalances elsewhere, especially above 0.5 in a long setup, should be ignored. Focus on the intersection below 0.5 in longs.
Before entering, wait for the price to return and sweep liquidity formed inside or directly before the order block. This confirms that the block is valid and a major player is active.
Once the sweep happens and price reacts (e.g., a strong bullish candle in a long), enter near the imbalance or block with a stop beyond it. This is the author's primary method for confirming valid order blocks.
The real edge comes from context: a significant liquidity sweep, an impulsive order block with a structure break and imbalance, and the final confirmation when price returns to sweep the liquidity left inside the block. Without a defined target and premium/discount context, even a perfect-looking setup is worthless.
Mentioned in this Video
Tutorial Checklist
Study Flashcards (10)
What is an order block?
easy
Click to reveal answer
What is an order block?
A zone/range in which liquidity was withdrawn from the market, followed by absorption (a counter-move).
00:58
What is the primary factor that makes an order block valid?
medium
Click to reveal answer
What is the primary factor that makes an order block valid?
The significance of the liquidity it removed; liquidity formed on higher timeframes is more significant.
01:25
How do you visually identify an imbalance?
medium
Click to reveal answer
How do you visually identify an imbalance?
Look for three candles where the first and third candles do not touch or intersect; the gap between them is the imbalance.
13:44
What does a structure break indicate?
medium
Click to reveal answer
What does a structure break indicate?
A change in market sentiment — the previously dominating party no longer dominates, and its stops are removed.
11:16
Why does a major player bring price back into an order block?
medium
Click to reveal answer
Why does a major player bring price back into an order block?
To close his false open position at least to zero, ideally using other traders' stop losses.
09:00
What kind of structure break does the presenter prefer?
easy
Click to reveal answer
What kind of structure break does the presenter prefer?
A breakdown fixed by the body, not by a shadow, preferably impulsive.
21:19
Where should an imbalance be located in a valid long setup?
hard
Click to reveal answer
Where should an imbalance be located in a valid long setup?
Inside the order block or on its border, below the 0.5 premium/discount level; imbalances higher up are ignored.
22:29
What is the final confirmation before entering an order block trade?
medium
Click to reveal answer
What is the final confirmation before entering an order block trade?
Price returns and sweeps the liquidity inside or directly before the order block, then reacts in the expected direction.
24:44
Why is higher timeframe liquidity more significant?
easy
Click to reveal answer
Why is higher timeframe liquidity more significant?
The longer the pool formed, the more stop-losses accumulated behind it.
02:05
What does an increase in volatility during OB formation signal?
medium
Click to reveal answer
What does an increase in volatility during OB formation signal?
That something significant is happening — large candles and rising volume suggest a major player is active in the zone.
19:38
💡 Key Takeaways
Significance of removed liquidity is the top validity filter
It shifts the focus from any swing to only high-conviction liquidity pools, which dramatically improves order block quality.
01:25Order blocks as a fingerprint of professional activity
It explains the underlying market mechanics, so traders understand why the zone matters instead of blindly drawing boxes.
05:12Manipulation to close false positions explains price revisiting the OB
This is the missing link that explains why price returns to order blocks and why the sweep confirmation is so powerful.
09:00Body-fixed structure break is a hard requirement
Filtering out shadow breaks prevents premature entries on false signals, a common mistake in Smart Money trading.
21:19Sweeping the liquidity inside the block is the real confirmation
This is the presenter's core edge and a practical rule that can be applied immediately to any order block setup.
24:44Full Transcript
[00:01] topic. It is theoretical, but we will also practice after we have covered the theory, come to the chart and look for the combination that we will talk about today. So the topic goes like this . Order block plus structure scrap
[00:15] plus imbalance. The best combination to enter. In fact, this is not just a loud name, it is a really very effective scheme. However, there are many details here that will affect this performance. And these details are exactly what
[00:29] I want to tell you today. But in fact, it seems primitive. In principle, everyone who is familiar with smartmane, I think, has encountered it more than once. But it doesn't work for everyone. Today we'll
[00:44] why it often doesn't work and how to find one that does. We have three tools. And I think everyone is familiar with them. They are very easy to identify on the chart. Ah, so I think everyone knows how to define
[00:58] an order block. This is the zone, yes, this is the range in which liquidity was withdrawn from us. next slide right away. That is, the Order block is our zone of liquidity withdrawal followed by absorption. That is, our
[01:11] task is to find the most valid order blocks. The most valid technical part first, and then we'll talk about why it works. That is, from a technical point of view, what influences the validity of the Order Block? And its
[01:25] validity is primarily influenced by the significance of the removed liquidity. That is, we are not simply interested in capturing some high or low, or some highs, likes, and so on. That is, we are interested in working with the most significant
[01:38] we consider significant liquidity. This is primarily the liquidity of higher timeframes. That is, it could be a single high or a residential one, for example, from single high or a residential one, for example, from four o'clock. This could be an accumulation of
[01:51] cascading liquidity, and so on. That is, equal hailai. That is, the more is, equal hailai. That is, the more time frame, and the higher the time frame in which it was formed, the
[02:05] more significant this pool will be . Why is that? I hope this is clear, because, firstly, the longer the pool formed, the more stops accumulated behind it. That is, if we say, for
[02:18] example, that here, well, some kind of high-profile film was shot, ah, and let it be some kind of, yes, there’s a five-minute story there. And, of course, what if this high formed not so long ago, for example, it
[02:32] formed an hour ago and now an hour later we remove it. It's clear that in an hour, during some liquidity certainly accumulated, but not the most significant one. Let's now imagine a situation where we have this lake block drawn on the daily chart,
[02:46] time frame, for example, 4 hours, and the price came and removed, for example, such an accumulation of cascading liquidity. That is, each of the highs hides behind itself market participants. And, accordingly, of course, such an order block will be
[03:01] much more reliable, right? That is, the first and most important point is the removal of liquidity by an order block, namely its significance. So here is the first point that you can remember, right? That is, we need to find the most significant
[03:14] order blocks. Not just any, not just with any acquisition, we'll talk about that today too, but with the removal of the most significant, uh, liquidity, yes, and now the acquisition right away, since I've already started touching on this topic. And the
[03:29] more impulse absorption, the better. There are situations when, for example, the price removes liquidity, say, with one candle. Well, it doesn't matter, liquidity is removed, there can be several candles quite calmly. And
[03:42] then we see something like this, yes, when the price cannot absorb this withdrawal. So we might end up seeing an overlap, yes, which
[03:54] would technically mean that, well, the order block would be confirmed here. However, worth thinking 1,000 times, if there is any major player here at all, because if we are talking about the overblock reflecting a set of positions with
[04:07] large capital, then, accordingly, what have we been doing here for so long, right? If a this case, a short underblock, that is, a short position, then having
[04:19] collected stop-losses here, what was stopping him from very quickly, yes, moving the price from here? And here is the question: well, nothing was probably bothering him. So the question is, why is there if we have blocked this impulse? That is, I, for example, never take such order blocks into
[04:32] work. And for me, one of the decisive criteria for an order block, I’ll tell you part of my trading strategy on this topic today, is the impulse exit. Moreover, the exit is not only this absorbing, yes, that is, not
[04:45] only an absorbing impulse, but I am also often interested in the price continuing to move in an impulse manner after the order block has confirmed itself . That is, the more impulsively it falls after the withdrawal of liquidity, the more likely it is
[04:57] that there is a really large player here, yes. Therefore, here is the first point specifically, if we now take only the order block itself separately, yes, this is the removal of liquidity, and also the nature of the absorption. And the withdrawal of liquidity,
[05:12] I remind you, must be significant. So, why does the order block work at all and why can we, yes, enter from an order block and expect some range of interests of professionals. That is, look, this kind of movement, from the
[05:27] point of view of market mechanics, is possible, in principle, only in one of the cases. This is when here, that is, look, we have some kind of liquidity pool, when the price comes here and a cascading activation of
[05:40] stop-losses occurs, which are located here, then someone kind of bought out these purchases, yes, that is, took them away in one word, one phrase, more precisely. That is, someone here made a this counter-offer that caused the movement in the opposite direction.
[05:55] Accordingly, the greater the impulse in the opposite direction, the more, accordingly, this indicates to us that a really major player has gained his position here. That is, due to these stops, yes, he filled up due to
[06:10] forced, yes, closures, that is, he filled up his transaction to the right size, ah, for him . That's why Urderblock is a range first and foremost for us, yes, that is, it is an indicator, uh, of the area of interest of professionals. Further, well, this is
[06:22] also, in principle, yes, what I wrote in the second point, that is, this is a reflection of the traces of, uh, a major player. That is, it is clear that recruitment is taking place, that is, there is is, it is clear that recruitment is taking place, that is, there is already some trace here. Next, often
[06:34] the charts today, that is, it forms important swing points on the chart, that is, as this for example, a healthy order flow. Here we have a price moving, moves, yes, it seems to follow the trend, then it comes back, climbs to the
[06:50] then it comes back, climbs to the high here and moves on. And this happens all the time. That is, one high is taken, the second high, and here and here
[07:02] these ranges, these will be the order block ranges. Accordingly, that is, we understand that in fact the structural points were formed precisely by order blocks. And if order blocks were formed here, then
[07:16] what does this indicate? That, well, the Therefore, in the ranges where we see these manipulations with liquidity, especially with regard to the trend. That is, there is a very high probability
[07:28] And this is also our chance, if we see, want to emphasize those upper blocks that a) formed according to the trend and b) when it happens exactly like this, that here we are going and it seems like a structural one
[07:41] deceiving everyone. You need to understand who is doing what here. That is, they see here, that is, they open shorts here, put stops here, and then this happens, that is, they are removed with a further, uh, downward movement, that is, a
[07:55] deception. And this is precisely the true formation of this , which was shown to us at the moment , yes, but the one who is filming it. You understand, right? I hope that's what I'm talking about. That is, such
[08:08] , but plus they will also work well, because if they are formed within the framework of a trend, then, well, naturally, we still have somewhere to Accordingly, there is always a high chance that there will be a further decline.
[08:21] , from which we can join this fall . And let's move on. This has a high potential for why. That is, because if a
[08:33] major player was gaining a position here and although no, I didn’t explain that, yes, let’s touch on that too. That is, if a major player was gaining a position here, then in order moves, yes, down, in order to move it higher, let's say, beyond this
[08:47] high, that is, what is happening here? A major player here falsely opens an upward position, that is, a long one, and in order to remove these stops, he then moves the position, or rather, moves the price down. That is, when the price has made this
[09:00] downward movement, large capital is left with the transaction that it opened in the wrong direction in order to remove these stop losses. And, here somewhere with his deal, it turns out that he still has an open
[09:13] long. This long needs to be closed. Yes, and it is desirable, of course, to do this either to zero, or to a small minus, and here even to a small plus. And this is precisely the reason why big capital, in exactly the same way, yes, puts
[09:25] pressure on the price in order to return it here and close this false position of its own and close this false position of its own at least to zero. And that is why order blocks are key areas for us , which we should,
[09:39] of course, pay attention to in a certain context. And with a good areas. That is, we understand that now large capital will close its deal here, after which the price will have nothing more to do here, it
[09:52] will move further down. And this is precisely our goal, that is, join this movement. Friends, an important point. We have a free Telegram channel where we publish educational content on
[10:06] SmartMoney trading every day. These materials are available only in our Telegram channel. Here are some tips and life hacks that you won't find on YouTube. Here we regularly publish content on trading psychology and show how to correctly open
[10:19] profitable trades. We periodically publish lists of promising coins for trading and provide tips on where to enter a trade and where to lock in profits. If you want to make trading a source of steady income, then subscribe to
[10:33] our Telegram channel. The link to the channel is now on the screen, as well as in the description below this video. Subscribe and let's trade together. tool. And this is a breakdown of the structure. What is a breakdown? That is, this is a violation of the
[10:48] last structural swing of the trend. So we have some kind of trend, it leaves these points, right? Yaki will sometimes explain, perhaps, different levels are at the conference. That is, you recognize the structural points and during a trend,
[11:03] let's say, during an upward trend, yes, both our highs and lows increase. But at some point we may have a situation where the last structural point, in this case the loy, that is, it is violated. And what does this mean? Yes, that there has
[11:16] probably been a change in market sentiment. That is, if we had a buyer prevailing here and this buyer, among other things, yes, placed his, uh , stops here, when positions here,
[11:29] here already at the last impulse. And, that is, if the buyer here did not hold here begins to prevail, then this is precisely what leads to the fact that the last structural point is violated, and the longs’ stops are removed here. And what does the
[11:44] movement tell us? The fact is that these feet, they are not needed here by anyone , right? That is, in the case, let’s say, if large capital needed these stops here do here? We would immediately see a movement like this in the opposite direction. And if this does not
[11:58] to observe here. That is, they didn’t just see the breakdown and go in. Here it is important to observe how the Because if we see such a movement immediately, then here, break, and immediately such an order block zone occurs, that is, it is
[12:13] formed, right? That is, if we understand that a large number of stop-losses have been activated here and, judging by the fact that the price is not moving higher, no one trend can change completely
[12:25] naturally, yes, and, accordingly, that is, the trend has indeed changed. Ah, yes, this indicates the end of the previous trend. Well, what comes out of it, said is that the breakdown of the structure is an indicator of the strength of one of the
[12:37] parties. That is, buyers no longer dominate here in this case. And the first point is that the structure strengthens the order block. After all, very often, it is precisely at the moments when an order block is formed that, on this absorbing
[12:49] impulse, a breakdown in the structure is formed. As for the Order Block, we have two main criteria for its formation - the removal of liquidity and absorption. We also have additional criteria,
[13:02] that is, those that will strengthen the validity of the Urzerblok and its reliability. And is precisely the elephant of the structure. That is, if we see the formation of an OB, yes, the the liquidity here and not just removed it, yes, we see that
[13:16] the price immediately during the absorption, uh, here or a little further breaks the structure, then, yes, this acts as an additional indicator of a change in trend really happening here is that the price will probably now be
[13:30] the price will probably now be driven in the opposite direction. And now imbalance. I hope that identify it. That is, imbalance is a kind of emptiness inside the candles. We need to
[13:44] see three candles where the first and the last, that is, the third, do not touch each other . That is, we see a dot here, a dot there. That is, this zone, where the first and second candles, the third, or rather, the candle did not touch each other, did not
[13:58] intersect, this is the imbalance. That is, well, here, I think, everything is simple. There is no imbalance detection indicator yet , be sure to turn it on. So, now let's figure out what the imbalance is. The imbalance increases
[14:12] the order block, as well as the breakdown of the structure. Why does it enhance both? Because, yes, let's get back to this mini-circuit. That is, we have lost liquidity here. Large capital moves the price accordingly in the direction of
[14:25] absorption. This happens so impulsively that the structure breaks down. And it is precisely the that the structure breaks down. And it is precisely the formation of this imbalance here that formation of this imbalance here that
[14:39] imbalance, we are dragging something there, it seems like we have broken the structure, but you look and imbalance there, there are a bunch of some candles that touched each other. This suggests say, not strong, not what we would like to see, right? If the tone
[14:55] structure occurs, uh, with the formation of an imbalance, or there may be several imbalances here, then this indicates that here the seller was much stronger than the buyer. Because what is imbalance? This is essentially a
[15:08] liquidity gap. That is, imbalance, if we recall its mechanics, it is formed when one of the parties, that is, the buyer or the seller, resistance. That is, for example, yes, our price is rising. And why is it
[15:20] because there is no counteroffer, there is no counteroffer. Accordingly, it is very easy for the buyer to raise the price here here, yes, if here, let's say, during the break word a buyer emerged, then
[15:36] means that here, accordingly, there was no counter here easily pushed the price down. Let's, in principle, move on to the next slide. The first and most important thing is that
[15:49] still don’t know what to do with it . That is, there must be goals for fixing the position. Here I have a good example of what cool and stand on with your steak. That is, what we
[16:03] see here is, firstly, an accumulation of this kind of trending liquidity, cascading, very, very many pools here, right? That is, you imagine that behind each of these small swings there seems to
[16:17] stop losses. Stop losses of those who went short here. Accordingly, in necessary to pay attention to such liquidity and, if possible, yes, enter into it. That is, if this combination were here , but these pools weren’t here
[16:33] , for example, here would be a situation like this, yes, what we, I don’t know, we OBOLAT this one, like this, we took everything here, everything that was, yes, and then like this we went to test it. And there would no longer be liquidity here. Well, accordingly, she wouldn’t be
[16:46] here. That's why we would like this combination, but here we have, yes, in both options, a block, and an imbalance, and a breakdown of the structure. Here it is. But this combination has absolutely no meaning here, no value,
[17:00] Therefore, the first and most important thing is that there must be goals. Well, this applies to any setup in general, yes, there must be goals in order to fix your position. Next comes the formation of order blocks and combinations, preferably
[17:15] this mean? What is meant is that this block is ours, it didn’t just form somewhere. That is, it should ideally be formed from some other area of interest. In this case, we see that this order block is from
[17:30] what timeframe? Well, it's 90 minutes. It turns out that this order block will look like two candles, probably on the three-hour clock, right? That is, we get an order block there of three or four, maybe a maximum of an hour, and the zone of interest from
[17:44] here from a higher time frame, namely, this imbalance from 12 o'clock. That is, we understand that here it is not just that, yes, a block has formed, there is a reason for this reversal, yes. That is, not only is there a trigger in the form of this
[17:59] liquidity pool that is being withdrawn, but here the stopping point is also, yes, some other zone of interest from a higher time frame. That is, the removal of liquidity and absorption in itself tells us that
[18:12] as it were, a tested zone of interest, which in itself is a hint and gives us, I would say, a big plus that we can expect a further increase in the price here. Next, this is the formation of an Order Block
[18:28] from the premium discount zone area. It didn't all fit on the graph here, but here we see, yes, here it is, the 0.5 zone. And our order block is ideally formed precisely from this range. So, we tested the audio out market here,
[18:42] after which the price started to rise. That is, if you have a story like this , that you have a trend, and here is your impulse, 0.5 will be somewhere around here, and the price goes here, and somewhere from here it
[18:56] order block for you, and you already want to go long, right? And if there's still untested, then entering somewhere around here , even if there's a lake block here, because very often you can see a
[19:10] small pullback, and then still enter where it should, and the price will then move further towards the targets that interest you. Therefore, ideally, of course, the order block would be formed in the case of a long
[19:24] from a discount market, and in the case of a short from a premium market. Further, no one myself, you could say, but it has a certain meaning. This is an increase in volatility during the formation of an order block. Well, first of all, we already
[19:38] strong, uh, impulse, that is, you see, yes, look how the price went here. Well, here, based on the size of the candles, it should be visually clear how grow. That is, how many candles do we have here? But the main growth was given to us by these
[19:54] two green ones, which covered so much here. Well, probably 10 pieces - that's the minimum number of candles that, well, would have provided us with this fall. That is, this is the first thing I already said. And there are also situations
[20:09] when, well, let's say, the price falls, and then something like this happens. That is, we come for liquidity, and
[20:21] here we can judge, in principle, by two or three candles. Here are some candles like these. One, for example, there is a second one here and here is a third one. That is, we are looking purely at this particular
[20:37] formation. And we don’t take into account the sizes of these three candles, yes, the impulse that we had further on, they are very different from the sizes of those candles candle size of all these downward movements was
[20:51] something like, figuratively speaking, like this. And here, specifically during the formation of the OB, there is a sharp surge, let’s say, in volumes. And here some, yes, huge sized candles begin to appear. This is also, well, one of the signs
[21:05] that something is happening here, yes. Further increase in the volume of liquidity withdrawal. I have already said this before. The next point is the breakdown of the structure with fixation by the body. I don’t really like it when the structure is broken by a
[21:19] shadow, and especially if this shadow is, for example, some big one, well, like like this , for example. There should be a break here, small body, and here some other big shadow. Well, this
[21:33] option is definitely not an option at all. Ideally, the candle should come and firmly establish itself behind this key swing that we are breaking, because this one, well, or there could be a shadow here, but at least then the next candle
[21:47] following candles, then it will count. If a shadow has simply formed here, and I already consider this a breakdown and want to go in here, then to see the body fixed. Moreover, the more impulsive, the better. Here is a good
[22:01] example of a breakdown. And we see that yes, here, by the way, is the first candle, it is here, you see, as a shadow. Ah, well, she didn’t secure her body here exactly above this swing. Here. But the subsequent ones already gave a clear, understandable breakdown. Therefore, here, in principle, it
[22:16] was already possible to break on this candle, and, it is clear, to identify them qualitatively. identify them qualitatively. And then this is the location of the imbalance within the order block in the premium or discount market area. What do I mean here?
[22:29] Ah, if we look at this example, let me just remove the unnecessary stuff here. If we look at this example, there are, a, two, ae, imbalances that formed either inside the order block, as well as one at
[22:44] its border. And the first one is the one I have highlighted, and the second imbalance is located here, small. But here, if you scroll through the timeframes, then here you can, see the imbalance here. It's possible somewhere around here. First of all, we are interested in
[22:58] the imbalance that has formed precisely in the order block, or on the border with it, like here, yes, here the majority of the imbalance is inside the OB and a piece of it is not inside. That is, this situation is ideal. Here. But not somewhere outside its
[23:10] borders, and not, for example, in the premium market. Well, let's imagine that we have have an order block imbalance, I want to work with this imbalance here." No, it format. That is, there are imbalances in the Order Block, they should
[23:25] act as a single point of contact for us. And if there are imbalances that are located higher, then they are simply ignored. That is, first of all, to summarize this point, we are interested in everything that is below 0.5. And first of all,
[23:37] both the imbalance and the order block intersect. That is, if there is we go down to the intersection of both zones, this is what we need. And further here is the point: a demonstration of
[23:51] power to buyers and sellers. There is actually a lot that can be said here. Well, here it’s more like, mm, yes, it’s exactly about the points that I already mentioned, about increasing volatility, about large, full-bodied
[24:04] candles, about increasing volume. Here you can connect if someone uses some additional tools, like, ah, some horizontal volume, a cluster chart, and so on. That is , yes, for those who have
[24:16] advanced a little further. That is, there are certain things that indicate, in its pure form, yes, but there are, as it were, certain services where you can see the current demand and supply. And this is another point, this is
[24:30] very important, this is essentially it, and without this I almost never use OB. This is the presence of liquidity within the order block or directly in front of it, yes, for further manipulation. What is this? What is this for? So there are order blocks, well,
[24:45] just order blocks, right? which, let me draw it now, which here, let's say, has captured the liquidity, confirmed itself through absorption and how people most often enter the market, even if, let's say, there is an
[25:00] an imbalance block, how people most often enter, that is, a limit order is placed here, a stop order is placed somewhere here, and that's it, we wait until it carries us there. Ah, but someone
[25:13] asked the question: "How can one determine that an order block might be invalid?" This is precisely what is used to determine it. That is, for me, if inside the order block, now I’ll draw it a little differently, if pull liquidity has formed inside
[25:26] the order block or on the border with it , that is, here it is, there is an imbalance somewhere and, for example, it has formed, and the price does something like this. There
[25:40] is a pig left here and the price starts to go down. I never go in here. I'm always I never go in here. I'm always waiting for this swing to be filmed. Why am I waiting? Because we discussed the mechanics of an order block and the fact that a
[25:54] major player returns the price inside it in order to close his how should he close his deal ? He also needs someone’s stop losses. And it is precisely this moment that gives him this
[26:11] zone, where he can close his own unprofitable position at the expense of others, by forcibly closing the positions of other traders. And here I found an example where this is exactly what happens. That is, we see here that we are testing a
[26:25] block once it happens, although we can already see that a swing is happens, although we can already see that a swing is forming here in the discount . Here people do what they do, they go long,
[26:38] and then suddenly the price returns here and confirmed. How is it confirmed? Withdrawal of liquidity and movement in the opposite
[26:50] direction. In essence, our second order block is formed here. And here, when this happens, that is, on the diagram it will look like this. We came down here and further movement from this liquidity is mm in this case upwards. That
[27:04] is, I immediately go somewhere around the market. In this case, the green candle closed here, and it was possible to either enter right here on the absorption , I often don’t wait. That is, if I have a sufficient risk-reward ratio,
[27:18] , then I work with this I set a limit somewhere, either at its beginning or already within the imbalance. Like this . But this is the key point. I would say that order blocks are essentially
[27:34] confirmed by this moment. That is, if I just place a limit order on this block or on this imbalance, somewhere here I put a stop here, that is, I just hope that this block will work and the price will do this.
[27:49] When I see that there is already liquidity left in it, which we then came and took away, and the price reacts to this liquidity, then this is precisely the design, it confirms the validity of this order block, and this is what I
[28:01] need. And I go to, accordingly, here is the blocking of the movement of the last seller. All. And, accordingly, this is my method, yes, this is the main method of how I confirm valid
[28:15] order blocks for myself. Naturally, I enter here, but only if there is a desire for pull liquidity to be present immediately. That is, I came in and there was immediately something to that I have the potential for there to be momentum here now. I also don’t
[28:29] liquidity is only here somewhere , and I enter here, well, you go halfway through emptiness, but here, in fact, there is a situation where there is no emptiness
[28:41] at all. That is, I open a deal and immediately a small movement here, where this movement begins to happen, well, practically without rollbacks, some small corrections occur, then it’s
[28:53] candle of a different color, because here . Let's look at some real examples. Well, here we have a situation that is, yes,
[29:07] not entirely, perhaps, pleasant , but in general it reflects the algorithm we are talking about. That is, here, and now let's see, we have a here, and now let's see, we have a
[29:23] hours. Here it is, yes, here is this entire descending range. And then in the premium market we have several areas of interest. This is an order block from a higher timeframe. Further, inside the ultrablock
[29:37] there is an imbalance partially on the border with it. And then we come to this song. What do we see? We see equal equal highs being removed.
[29:55] The structure has been broken. Right here. Well, here the only way to break it is via Right here. Well, here the only way to break it is via SMS, right? Not a regular break-in, but via SMS. Oh, and what else isn't very beautiful here, right? The fact that the order block, you see, yes, what it is
[30:09] here. That one will be here on the higher timeframe. Here it is, highlight it, just so that the chart doesn’t look too garish. That is, this shadow of the candle is precisely our order block. And here the detail is that
[30:23] we are getting a breakdown of the structure , that is, here is our block, here is this shadow, here is this whole candle. That is, we have a kind of breakdown of the structure , yes, it happens after this block has been tested. You see, this is an
[30:36] unusual situation. So here it is, the block. That's where we stopped, went and only then did we break down here via SMS. That is, here, well, if we were to enter, then the only opportunity was due to these very imbalances
[30:50] . Well, here I repeat, the downside is that the OB has already been tested. Here. That is, well, technically, it would have been possible, in principle, to consider an entry point here. There's a good context here if we look at it globally
[31:03] . Here. That is, there are two imbalances here that were formed during the break. We continue to test them here, although we didn't get to where we needed to go super quickly although we didn't get to where we needed to go super quickly , but nevertheless, the price did eventually
[31:15] , but nevertheless, the price did eventually drop lower. let me skip ahead, probably a little bit further here. We ended up, yes, on the sideways,
[31:28] because the price here went sideways. In a word, he started drinking. And here we come, if we were just shorting here, then we would be shorting at least here, and maybe even somewhere over here on this piggy bank
[31:42] and, perhaps, even a steak on this imbalance. It turns out that, well, were still a few days of work, that is, we would have entered, uh, on July 18, but it turns out the take would have been on the twenty-fifth. That is, the timing is not small. Here. And what
[31:59] manipulation of liquidity within the order block. Here we see, you see, we still have this little pig left. And so we came for him. Once. Further. Well, here there
[32:15] happen? Well, here, probably, mm, it was just that the major player lacked liquidity. Why did he carry out multiple manipulations here? That is, one, two. And now, apparently, here, when it
[32:27] was already enough, yes, that is, we really did go down. Here. Well, initially the context here was, in principle, short, and it was clear that the price would move further downwards. Let's move on to the Lash timeframe. Here we'll cut it like this
[32:39] . That is, we have an order block right here. on four. Let's highlight it. Like this. That
[32:54] Let's highlight it. Like this. That is, here, by the way, mm, to the question of increasing volatility, that is, you see, right? That is, the average size of the candles in this entire downward movement, you can see for yourself
[33:06] what it is. And it is precisely due to the formation of an order block that such a spread the volume increases and everything is clear what is happening here. Further, inside the OB we observe a happening here. Further, inside the OB we observe a balance, which is what interests us here.
[33:21] Next, let's move on to an hour. That is, this will be our trading range from a given low to a given high. And now we are going below 0.5. Here, a test of both the order block and the imbalance test occurs simultaneously . At the same time, what I love is
[33:36] being stripped of its liquidity. That is, you see, right here at that moment, this is what happened. If we remove this piece, then here, well, as if for the crowd, let's say, here, you see, well, the imbalance has already been tested here, I
[33:50] must say, because on the hour, this is where the imbalance begins, this is where the imbalance was tested, and the order block was also tested here, you see, right? And, accordingly, I think many people here have already opened deals either
[34:04] here, on this movement. And what happened next was that I came back and removed all those early longists. And here it is , here it is, the second order block that the acquisition, I like to enter in situations like these.
[34:21] Removal, deeper test discount market. And here it was possible to switch to a candle. Well, here, in principle, it would have been possible to even enter on this one. Here there was almost complete overlap, that is, confirmation of the order block. Here there
[34:36] was almost complete absorption of the entire downward impulse. That is, either on this candle, or already on this one . That is, here was the most but the ratio would not have worked out here. That is, here, in principle, the only chance
[34:50] was to go out here for absorption with a stop here and a take profit. It turns out that, well , at least for this compression, here at 50% of this imbalance, a good situation. And the same goes for the increase in volatility, that is,
[35:03] you see, yes, again, what the last candles look like, their size. And it is precisely on and forth movement occurs with, well, a kind of increase, uh, a
[35:15] candles. And just like that, there is an increase in volume here. Not the same as here, of course, but also, if we take the average volume here for the last few hours, then we see that this volume is approximately, well, 50% more here
[35:28] than for the last 10 hours, which also indicates that certain indicates that certain processes are taking place here.