
Why Retail Traders Always Lose to Smart Money
60sExplains a common trading mistake with a clear psychological insight that resonates with many traders.
▶ Play Clip"Delivers a solid explanation of false breakouts with real examples, though it repeats the same concept multiple times."
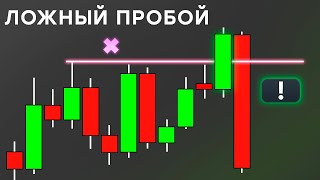
This video explains how market makers use false breakouts of consolidation boundaries to trap retail traders and accumulate positions. It emphasizes the importance of determining the overall market direction on higher timeframes and provides examples of how to identify and trade these setups.
Market makers create false breakouts of the upper boundary of consolidation to trap retail traders who expect a continuation. The price often updates old highs before an impulse fall.
Retail traders place orders above and below consolidation boundaries, believing them to be strong support/resistance levels. They chase breakouts, leading to a large accumulation of orders above the upper limit.
Smart money evaluates the asset and allows the price to reach levels where liquidity is concentrated to fill their sell orders. They do not follow the price; they use the liquidity from retail stop losses.
In a bearish market, a false breakout upwards (green candles) is a signal to open a short position. The main target is liquidity below the previous low, and the position is closed by buying back at that level.
In a bullish market, a false breakout downwards is a signal to open a long position. The main target is liquidity above the previous high, and the position is closed by selling at that level.
The presenter shows recent trades from his Telegram channel, emphasizing that the same fractal patterns appear on all timeframes. He focuses on higher timeframes for swing and medium-term trades.
Determining the general price direction on higher timeframes is the basis for effectively using this theory. Without it, identifying false breakouts in real time is not possible.
Markets fall or rise to restore balance in ranges where price was offered inefficiently and to activate stop losses. Smart money controls 100% of price movement, and the price moves to where stop losses are to activate them.
The presenter shares a past forecast: Bitcoin at $46,000 and Ethereum at $3,500. He expected a drop to $28,000 liquidity before any new all-time high, with a 95% probability.
Smart money distributes profitable long positions in the premium market and accumulates new short positions to assess the asset in the discount market. Stop losses below $28,000 will be used for re-accumulation.
The presenter shows opportunities for short positions starting from $48,000, emphasizing that the best opportunities appear when updating old highs in a bearish market.
A medium-term short position was opened based on this analysis, with the target of $28,000. The position was closed by linking buy and sell orders, as smart money does.
The presenter uses two exchanges to open a second position in the same direction while the first is still open, with a risk-reward ratio of 1 to 7.
The presenter provides eight examples of false breakouts of upper and lower boundaries, all identical to the described pattern. He encourages viewers to analyze them and emphasizes the importance of higher timeframe direction.
The key takeaway is that false breakouts are a recurring pattern used by smart money to trap retail traders. By determining the overall market direction on higher timeframes and waiting for false breakouts at consolidation boundaries, traders can align with smart money and improve their probability of success.
What is a false breakout?
A false breakout occurs when the price moves beyond a consolidation boundary but then reverses, trapping traders who expected a continuation.
00:03
Why do retail traders chase breakouts?
They believe that breaking a resistance or support level signals a continuation, and they lack understanding of market clues.
02:34
What is the main goal of smart money when they create a false breakout?
To use the liquidity from retail stop losses to fill their own orders and accumulate positions in the opposite direction.
03:19
In a bearish market, what signal indicates a short opportunity?
A false breakout upwards, often accompanied by full-bodied green candles, which acts as a signal to open a short position.
04:20
What is the target for a short position in a bearish market?
The target is liquidity below the previous low, which is the lower boundary of the consolidation.
04:35
Why do markets fall or rise according to the video?
To restore balance in ranges where price was offered inefficiently and to activate stop losses.
11:22
What is the fractal nature of the market?
The same patterns repeat on all timeframes, so false breakouts occur similarly on lower timeframes.
07:39
What is the first step to effectively use this theory?
Determine the general price direction on higher timeframes.
08:46
What did the presenter predict for Bitcoin?
He predicted that Bitcoin would not reach $70,000 until the $28,000 liquidity was removed, with 95% probability.
14:58
How can you open a second position in the same direction if the first is still open?
By using two different exchanges.
23:04
Smart Money Uses Liquidity
Explains the core mechanism of how smart money profits from retail stop losses.
03:19True Reason for Market Moves
Challenges the common belief that markets move due to supply/demand, instead citing liquidity and balance.
11:22Bitcoin Price Prediction
Provides a specific, testable prediction about Bitcoin's price movement.
14:58Using Multiple Exchanges
Practical tip for traders to manage multiple positions.
23:04Fractal Nature of Markets
Emphasizes that the same patterns repeat across timeframes, making the strategy scalable.
24:31[00:03] In this video, we will analyze how market makers use the test for their purposes and what the masses do at this time. A false breakout of the upper market. In other words, this is when the price moves
[00:18] in a downward trend or when you expect this to happen before each significant development. The same dream scenario is always repeated: update old highs and only then does an impulse fall begin.
[00:34] Why does this happen and what do retail traders do at this time? As you already know, the price consolidates most of the time. The main point of what happens at such moments is the formation of orders above and below the current
[00:51] market price. The masses will open their previously positions when the price is between the sideways boundaries consolidation boundary depending on the direction of their positions. This
[01:07] occurs because, based on the tradition of technical analysis, the consolidation boundary is represented by strong support and resistance levels.
[01:19] trades on a breakout places their limit orders to buy above the piggy bank, which is considered the upper boundary of consolidation, counting on that after As the price rises above the upper limit, upward price formation will continue.
[01:35] At such moments, full-bodied rising candles always appear, which, full-bodied rising candles always appear, which, combined with their desires and analysis based on some bullets, give them a bias for opening a longing position.
[01:50] bias for opening a longing position. They will chase the price, so above the upper limit of the range, there will be a large accumulation of hordes of even buying traders who opened short positions while the price
[02:03] was between the range boundaries and traders who are trading. Try it. The longer the consolidation lasts, the more arthro will be able to accumulate above and below its boundaries. All available liquidity will be used to fill or
[02:19] drop smart capital. Retail traders wait for the breakout and because this gives them the opportunity to determine the further price direction in which they will open positions. This happens because they have no
[02:34] idea what clues the market can give; they simply chase the price. So, after the update of the upper limit of the range, the masses will buy because they believe the resistance level has been
[02:50] broken and now the upper limit of the range has become the support level. They hope for continued growth. At such moments, half-bodies always appear. and green candles, which,
[03:03] combined with their desires and analysis based on some patterns, give them biases for opening a long position during consolidation. Smart capital's actions are completely contrasted with what the masses do.
[03:19] They evaluate the asset or allow the price to reach a certain level above which liquidity is concentrated in order to use it to fill their sell orders. Smart money does not try to follow the
[03:33] price. Paid candles never act as an indicator that the price will continue to move in the same direction. You will often see traces of their money in movements that go beyond the upper and lower boundaries of the sideways trend.
[03:50] When, based on higher timeframes, the market is bearish, then, according to oils, green candles updating liquidity for buying will act as your signal to open a sharp position. This will happen on absolutely all
[04:04] every time according to the same scenario because the market is fractal by nature. Each situation will be different in the same context in which consolidation is formed.
[04:20] subscribing to my Telegram channel. Here I write about trading analytics and thoughts on You will find a lot of useful and interesting information for yourself as a trader. Follow the link in the description below the video. The
[04:35] main goal for such a position will be, as you can see, to sell. It is located below the previous aloe, which is the lower boundary of the range. To close a short position, we will have to buy, and therefore
[04:50] we will fill our buy orders with stop losses for selling, which are below the old one. We connect the buy orders that we used to open a short position and the sell orders that we need for it. A
[05:09] consolidation is typical for the former market. You will need to determine the general direction of the price on higher timeframes. To effectively identify this, the recipe is applied. Traders will wait for the lower boundary to be tested because this will give them the
[05:26] opportunity to determine the further direction of the price, which they will open positions with after updating the lower boundary of the range. The masses will sell because they believe that the support level has been broken and
[05:40] now the lower boundary of the range has become a resistance level. They hope for a continuation of the fall. Usually, an exit beyond the lower boundary of consolidation will be accompanied by the formation of a sweat of their falling candlesticks which, in combination with
[05:56] indicators and bearish formations that they will definitely find there, give them biases for opening a lung position. position. If, based on higher timeframes, the market
[06:10] would be someone's smart money would buy a breakout of the lower limit of consolidation, and liquidity for sale under the old meadows and lila pit will be used to fill buy orders for the purpose of further assessing the asset,
[06:25] and the formation of a payment of their falling candles will act as your signal for opening a lung position. The main goal will be liquidity for buying, it is located above the previous high, which acts as the upper limit of
[06:41] To close a lung position, we need liquidity for selling, therefore, we will fill our sell orders with stop losses for buying, which is consolidation. We link the buy orders that
[06:57] we used to open a short position and the sell orders that we need to close it. This is exactly what smart money does at the banking level. Now let's look at several recent
[07:12] opportunities that I used. This was broadcast on my telegram channel. I think many of you entered into similar transactions over the past 3 months. I started Prioritize swing and medium-term trades,
[07:27] so only higher timeframes will be shown here, used for intraday or scalp trades on lower timeframes. It
[07:39] will work exactly the same as on higher timeframes. Due to the fractal nature of the market, you will see the same thing down to the second timeframe. The chart shows a classic
[07:52] sales model that smart money uses to evaluate an asset, but it has nothing to do with likes, and this applies specifically to the table. What I just described in the diagrams on the left side, you can see a
[08:06] false breakout in a downward direction and subsequent asset valuation, and on the right side, a breakout of the upper boundary of the range before further asset valuation.
[08:18] As you can see, before each development, the same thing happens. The only difference is in the price direction. We will focus on bearish examples simply to save time on this three-month consolidation and on a
[08:33] short internal consultation. But in order for you to be able to identify a false breakout in real time, you first need to determine the general price direction on higher timeframes.
[08:46] This is the basis. Without which, it will not be possible to effectively use this theory. When you understand that the market is bearish, then when the price exits, it forced the maximum and you always have the opportunity to open a highly probable
[09:01] short position. And if the market is someone else's, you wait for the withdrawal of old life in order to open a longing position.
[09:13] timeframe. With just this help, we can quickly determine the potential future price direction. That is, we will have a bias in which direction it will work optimally. This will not mean that the price
[09:28] will always rise or fall, but we will know what to do when the price updates old swings, immediately the upper or lower boundaries of consolidation. First of all, you should focus your attention on their balance, liquidity.
[09:44] With this, you will determine the future direction of the price and, accordingly, the structure after updating the old maximum. The price was unable to consolidate above Niva in October and November, a
[09:59] typical reversal formation was formed, which, by the way, we will analyze in the future when passing the topic of their balance. We are interested in both confirmation and the beginning of a downward order flu in December. It was confirmed by this
[10:15] aggressive downward movement at the close of the next month. A bearish balance has been formed, which is the main sign of the beginning of a downward order flu, and also back in December, a
[10:28] bearish vor der hook was confirmed during the update of this growing, full-strength You will see such situations incredibly often. This will always show a high probability of working out
[10:41] on all timeframes. Within the bearish vor der hook, the bounce was formed by it. The price will strive to reach this area before continuing to fall. Therefore, it will be relevant to expect that
[10:54] after updating the high of this January candle, a reversal will occur in this range, which will be your opportunity to open a short position. The main target will be the old minimum and
[11:07] those which are in the range of 28,000 and the monthly bounds are not the groom. The price will strive to partially or completely fill it. That is, after removing liquidity from the upper boundary of consolidation,
[11:22] side or the price balancing in this way. Because the market falls or rises for two reasons, and this is to restore balance in the range where the price was offered ineffectively and
[11:38] where the price was offered ineffectively and in order to activate a stop loss. in order to activate a stop loss. That is why the market falls or rises, it is not because there are more sellers than buyers, or On the contrary, it's not because there are
[11:50] no buyers or sellers left in the market. I also have nothing to do with the so-called pressure from sellers or buyers. Remember, smart money controls 100 % of the price movement, and the market
[12:06] will never care whether you're in a position or not, or where your stop loss is located. The price moves to where the stop loss is to activate it and fill it.
[12:18] Inefficient pricing is used to balance the price. Here, I want to insert a short excerpt from one of the lessons I taught in my office. In it, I talk about expectations regarding the future
[12:32] price direction for Bitcoin back when the price was at forty-six thousand and for Ethereum at three and a half thousand. The most important thing is the future price direction. When we understand it and the plan is
[12:47] gradually implemented, then scientists will find many better positions, and at the same time, the majority of the market will fall into the trap that smart money forms, luring traders into opening positions in the wrong
[13:03] direction. You will be able to act exactly as smart money did: fill your sell orders when your buy stop loss is activated, and buy when your sell stop loss is activated
[13:17] buy when your sell stop loss is activated because the analysis was conducted from higher to lower timeframes and, accordingly, long-term, medium-term and
[13:31] short-term plans were drawn up, but the main point is the same as I just told you, that it is not necessary to switch to it if anything in order to form a medium-term bias regarding the
[13:45] future price direction. What do the so-called smart money do in the premium market? They distribute their profitable scrap into positions and accumulate new short positions with the aim of further assessing the asset in the discount market.
[14:02] assessing the asset in the discount market. Stop losses below 28 thousand will be used for re-accumulation in your position with the aim of further markup of the I think that we can expect consolidation in the range of
[14:15] range of 24-20,000 for several weeks and then consolidation back in this range above the updated life. What will the masses do who trade different levels and paderno here where we
[14:30] see equal minimums and that is, half of the liquidity. They see a support level liquidity. They see a support level from which they will buy. We, in turn, will be interested in buying their stop loss and when the price is beyond
[14:45] these minimums, perhaps many Some of you are already expecting a new all-time high and a value of around 70-75 thousand. I don't expect this, and with a
[14:58] 95% probability, Bitcoin will cost 70 thousand only when the 28,000 liquidity is removed, and I expect the global market to implement exactly this scenario. If we look at the last three months,
[15:13] we can see that the price is slowly developing in an upward direction, developing in an upward direction, updating the high of the previous month, and now it has already reached the main zone of interest, from where we can expect
[15:25] the formation of a stop in the short and the beginning of a downward order. Full is the monthly We can notice that Ethereum, unlike month. Such discrepancies will be a
[15:40] strong additional factor for considering short positions. This is further confirmation that the market has already been bought. We can also note that in addition to the fact that the price is being manipulated by highs, we have
[15:53] formed a trend liquidity. We can expect that when it is removed, there will be will immediately reach the fly about the appointment of 1700.
[16:06] Here, the situation is the same as with Bitcoin. The masses expect that the price will react from this level and the upward trend will continue. We will do the exact opposite, we will wait until their stop loss for sale
[16:21] is activated and smart capital Siri accumulates its positions and after this, the upward pricing will continue, as you can see, the global plan is no Bitcoin. Now let's look at the opportunities that
[16:37] could be used for attacks starting from 48 thousand. I will repeat again due to the fact that the higher timeframes indicate a downward direction, we will look for a short position.
[16:51] The best opportunities before an impulse fall will always appear when updating old AIFs. This is exactly what we should always focus our attention on. We will analyze the moment of the so-called breakout of
[17:05] two sides of the situation. The trader's ritual and smart situation. The trader's ritual and smart money are technical analysis believes that these equal maximums are a strong resistance level
[17:21] equal maximums are a strong resistance level bearish, opening a short position. But what do you think will happen if the price breaks through it? The
[17:35] resistance level will become a support level. full-bodied green candle, the masses will be bullish, expecting that growth
[17:47] will continue after testing the now support level. The market support level. The market close when they see a pulse rise or
[18:02] fall, they will get the feeling that the price will continue to move in the same direction and this will not end soon. They will also take into account other factors, indicators, patterns and support and resistance levels,
[18:17] indicators, patterns and support and resistance levels, Retell traders will wait for a breakout in order to determine which direction to open their positions. This happens because they have
[18:33] no idea what clues the market can give, they are simply chasing the price. Remember how exactly you behaved in this situation, what you thought and what positions you ultimately
[18:47] Also, pay attention to what public traders from your info bulletin said and wrote. public traders from your info bulletin said and wrote. them talked about a new full-time high from these values.
[19:04] Smart money in a bear market will create a breakout of the upper boundary of the range. A stop loss on a buy that is located above these values will be used to fill the order book exactly for a sell order before further depreciation of the asset.
[19:19] It is at this moment that a Rio cumulation of a short position occurs in a deep discount market Rio cumulation of a short position occurs in a deep discount market will always see traces of false breakouts on the chart that smart capital leaves when delivering
[19:33] [music] If you see the appearance of full-bodied growing candles, reshoot and liquidity from the upper boundary of consolidation, this will not be any factors for
[19:51] position, and in the future, such full-bodied candles will become a bearish block order based on which you will also be able to consider positions in a downward direction from and here there was a filling or firewood
[20:05] for sale, think about where there will be an optimal opportunity to fix the profit. There is liquidity for sale. The target will be the lower boundary of this consolidation, and based on the monthly
[20:19] priority, equal to Ilyina 28 thousand are the main target, so we will wait for the asset to be assessed at these values.
[20:32] Here is my medium-term opposition, which was opened based on this analysis, the date is indicated in the upper left corner, this was all broadcast to us on the public telegram channel, and here the processing and
[20:48] closing of this position is already shown, we are linking the purchase orders that we We used the ford position and sell orders to close it, which is exactly what smart money does at the
[21:03] bank level after the price has consolidated back in detail and x, and we expect the price to develop downwards. Urghu, in the we expect the price to develop downwards. Urghu, in the
[21:18] before updating equals, caught at thirty-seven thousand, began to consolidate and move in the opposite direction to the true movement. that often occurs before an impulse fall
[21:33] near a significant pool of liquidity for sale. A false pump will occur in order to balance the price and remove liquidity for purchase above old highs. This will provoke traders to open positions in the wrong direction,
[21:48] creating new liquidity. You will always encounter similar pricing on all timeframes. You will always encounter similar pricing on all timeframes. bear market. We focus the Turk's attention on the bearish balance and old x, and
[22:04] when the price removes liquidity for purchase or balancing the price, these are your opportunities to open a highly probable short position.
[22:17] false breakout of the upper limit of consolidation and partial filling. As you can see, this pricing is no different from the first example of a bearish balance. The trigger point from which it was relevant
[22:33] to consider opening a short position was a bearish block order on four hours within the weekly balance. Here is where I opened my slingshot position with the goal of updating the catch at thirty-seven thousand.
[22:49] Here is what this transaction looked like in the upper left corner. The date of the screenshot was created. Well, I immediately showed it in the Telegram channel after the opening. You may wonder how you can open a second transaction in the same
[23:04] open a second transaction in the same direction if the first one has not yet been closed. I use 2 exchanges for this. I opened this position on the [unclear] ...]]]]]]]]]]
[23:18] position with a 1 to 7 Spark ward. We did the same thing as I described before. We used a stop loss to buy above the old AIO to fill my short position and fixed it and below the old wallpaper for
[23:34] which we were located. Liquidity for selling You don't have to be tied specifically to swings or with René funny trades. This can also be used to open scalp positions. and for intraday
[23:50] trading in this case, determine the general price direction using the daily and four-hour timeframes and do the If, based on the higher timeframes, the market is bearish, then wait for a false breakout upwards
[24:06] at the border of consolidation. This will be your best opportunity to open a position, and vice versa when p
[24:18] many more such examples because this happens before every significant development, but this will be a repetition of the same thing. but this will be a repetition of the same thing.
[24:31] Here are 8 examples of a false breakout of the upper and lower boundaries of consolidation. You can analyze them yourself in detail because they are identical to the showed. If you go to lower timeframes,
[24:45] If you go to lower timeframes, you will see a dozen more such situations. The main thing you should do is determine the general direction of the price based on higher timeframes. If you are right, you will have many
[24:59] opportunities to open high- probability trades. It contrasts with the crowd, then you will have positive results over the long term. If you learned something new in this video and you liked it, then like it and
[25:14] write comments because this will greatly help promote this video. And also, don't forget to subscribe to my Telegram channel. The link is in the description.
⚡ Saved you 0h 25m reading this? Transcribe any YouTube video for free — no signup needed.