
3 Ways to Spot Strong vs Weak Assets
45sQuick, actionable trading tips in a list format are highly shareable and save viewers time.
▶ Play Clip"Delivers exactly what the title promises with clear examples, though some repetition and a standard subscribe ask at the end."
This video explains a systematic approach to identifying relative strength and weakness between correlated financial assets. The presenter outlines three key indicators—SMT (Smart Money Technique), structural separation, and candle closures—and demonstrates their application through multiple TradingView examples.
The goal is to long the stronger asset and short the weaker asset among correlated assets.
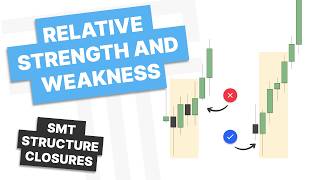
The three indicators used are SMT, structure (separation), and candle closures.
SMT is the difference in structure between correlated assets, e.g., one makes a higher low while the other makes a lower low.
The asset making a higher low is stronger; the one making a lower low is weaker. This flips in a bear scenario.
When SMT is not present, use the separation from an extreme low or high; greater separation indicates strength.
Candle closures can indicate strength or weakness, e.g., a bullish close after sweeping a low vs. a failure to close above a prior level.
Pairing SMT, candle closures, and structure provides a comprehensive view of relative strength.
NASDAQ made a lower high while S&P made a higher high, showing NASDAQ weaker and S&P stronger.
S&P had a strong bullish close while NASDAQ had a doji, indicating S&P strength.
S&P was closer to a previous high than NASDAQ, showing S&P strength via separation.
SMT and candle closures showed gold GDP weaker than gold futures, leading to a continuation lower.
Multiple SMTs across different timeframes can confirm the same strength/weakness conclusion.
Relative strength is not constant; it can switch between assets over time.
Separation from lows showed gold euro stronger; it also took out highs first.
Combining SMT, separation, and candle closures identified the stronger asset for a long trade.
This method should not be used alone; it requires a higher timeframe framework and a strategy.
Three-Part Framework
Provides a clear, structured method for a common trading challenge.
00:29SMT Rule of Thumb
Simple, actionable rule: higher low = stronger asset.
01:09Candle Closures as Signal
Shows how price action details can reveal underlying strength.
02:25Real-World Application
Demonstrates the concept on live market examples, making it practical.
04:05Caveat on Usage
Emphasizes that this is a tool, not a standalone strategy, preventing misuse.
15:19[00:00] How's it going everyone and welcome back to another video. In this video we are going
[00:15] to talk about relative strength and weakness. Now this is a highly requested video and generally I want to be longing the stronger asset and shorting the weaker asset. So let's get into the PDF on how I do this. So now there are three things that I look for when determining
[00:29] relative strength or weakness between correlated assets. The first will be SMT, the second will be structure, and the third will be candle closures. Let's go over all three of those. The first one and the easiest is SMT and that is
[00:42] between correlated assets, the difference in structure. So here you can see this is a low and this is the same low. We take a look at the same low here and the same low here. They are making differences in structure. You can see this low is a
[00:57] a higher low relative to this low, while this is a lower low relative to this low. This is showing that this is a weaker asset that is making a new low, while this is the stronger asset as it is
[01:09] making a higher low. So simply put, the one that makes the higher low is the stronger asset, and the one that makes the lower low is the weaker asset. And this will be the same in the bear scenario, but just flipped around. So if I'm looking to take a long, I want to focus on the
[01:24] stronger asset or the one making the higher low and the weaker asset if I'm shorting or I want to avoid this for long setups. The next one is structure and this is what I use when S&T is not present. So taking a look at that same low, the correlated lows here, you can see we do not make
[01:41] a difference in structure. These are both higher lows. So you can see this is a higher low relative to this one. This is a higher low relative to this one. So what is the difference? You want to take a look at that extreme low and then the separation between the new low and that. So you can see from
[01:57] this higher low, there is a decent separation between the previous low. However, on this asset, there is not much separation, right? It is quite close relative to this low, making almost equal lows. So when there is not S&T present, you can take a look at the separation. The greater the
[02:13] separation, the stronger the asset. So you can see here, this is a stronger asset relative to this one because it is farther away from the extreme low. So now that you've learned about SMT and the
[02:25] structure or the separation between structure, let's take a look at the third one, which is candle closures. Now this is a bit more of an advanced concept in terms of relative strength and weakness, but when you're taking a look at candle closures, they can tell you which asset
[02:39] is stronger or weaker. Let's go ahead and start out with candle 2 here on the low. You can see we sweep out the previous low and close nice and bullish. However, on this weaker asset, we sweep up a low but we can't close bullish or back above candle 1's low. This is a pretty solid
[02:54] sign that this asset on the right is stronger because it is showing that strength in its candle 2 closure. Now as we continue into candle 3, you can see they are relatively the same there, but candle 4 also shows the strength, right? This is closing as a bullish candle, while on the weaker
[03:10] asset, this is a bearish candle. So you can see here, if you're just taking a look at these candle closures, you can use candle closures alone to determine relative strength or weakness. As you can see, this is a stronger asset on this random candle right here. We look at that same
[03:26] candle over here and it shows weakness, right? A doji candle closing back inside its previous candle while this one is closing over. So when you pair all three of these things together, SMT, candle closures, and structure, that is what I use to determine relative strength and weakness
[03:42] through correlated assets. Let's get into TradingView and go over a few examples. So here we are with our first example and before we begin it is important that you understand that you can only do this with correlated assets So for example here is the S 500 here is the NASDAQ These are correlated assets and they should have the same structure but sometimes they do not So
[04:05] here you can see if we reference the same high right here, so the same time term high, what do we notice? We go ahead and mark that out on both assets. One asset has taken that out while the other hasn't. So we can go ahead and consider
[04:19] that in S&T, or a divergence between the assets, as NASDAQ has made a lower high, while the S&P has made a higher high. So by using that, we can determine which is stronger and which is weaker.
[04:32] The NASDAQ is weaker, as it is making the lower high. The S&P is stronger, as it is making the higher high. So that is how you use S&P to determine relative strength or weakness.
[04:44] Now the next one is separation in candle closures. Let's see if we can also do that on this example here. So let's let this play forward and see if we can find any examples of that. So you can see very similar structure in terms of candle closures between these assets here.
[05:00] You can see weakness in both assets. So after we play through that candle, you notice the S&P has a strong bullish candle closing over the body, right? A nice candle to closure. If we notice on the NASDAQ here, we have more of a doji, a small range candle.
[05:16] So what is that telling us in terms of just candle closures and strength and weakness here? It shows us that the S&P is stronger, the NASDAQ is weaker. Let's let this play ahead. You can see that on this next candle, it becomes very clear.
[05:30] We're not only taking out this previous candle's low, which we are not over here, but look at the closure. This is a doji candle, while this is an engulfing bearish candle. So combining those things together, what do we notice?
[05:42] We notice that we have the weakness from the S&P. We're using candle closures to also show us the weakness and the strength on this side. Let's also see if we can use one which is separation.
[05:54] And we can start to see that here. Let's take a look at the separation from this previous high. So if we're marking out this previous high on both assets, how close are we to this high?
[06:06] And if you notice with the S&P here, we are relatively close to this high, only a few points away. How close are we to that high on NASDAQ? We're quite far away from that high.
[06:19] So you can see the separation between those assets also shows you the relative strength and weakness. So when you combine all three of those things together and practice doing that, you really understand the relative strength and weakness between assets.
[06:32] So once again, SMT shows strength or weakness. We can use candle closures as well as separation. So if we let this play ahead, what do we notice, right? We notice they both get a drop-off, but which drop-off is substantially weaker?
[06:48] Well, that would be NASDAQ, right? It has a larger move, and this is just an anomaly of a day, but it has a great example of combining all three of those things that we look for together. Let's get into another example.
[07:00] So here we are in another example and we have gold futures on the right here and then we have gold GDP on the left here. Let's take a look at this price action here and what do we notice? Let's say we're going into this with a bearish bias.
[07:15] So we can take a look, take a look at our current high and look to the left. We've taken out this high here. All we have in on this side. So what is that? That is an SMT. And what does that tell us? Is gold or gold GDP weaker?
[07:30] GDP right now what's another thing we can look for well in this case we don't have separation from these highs but you can look at the separation from the lows right which is also sometimes just another SMT if you notice we're taking
[07:44] out this low here well we are not taking out the low here so that shows that this asset is weaker while this one is stronger we don really use separation much in this example here but let take a look at the closures and this one has a specific example of where it is important if you notice we take a look we zoom in here
[08:04] you can see not much difference in the closures but there is one big thing we notice here you notice how this candle closes below validating this change in the state of delivery well if you
[08:16] take a look at this same example on the right here we can't close below that level so where where does that show me? It shows me that there is weakness in gold GDP while gold is a slight bit stronger. Do they both work out? You can see they both continue lower, but that is a good
[08:33] example of where not all three will show up. But one thing I really want you to pay attention to is a lot of times the closures, specifically candles that create the change in the state of delivery or continuation, will show you that relative strength or weakness. So another just
[08:49] small example here is if you take a look at this price action here, it's very subtle, but what do we notice? This candle is closing over its previous body. This one is not. And it shows you that this
[09:01] one has the strength at that time, right? Taking out this high first. Let's get into another example. So here we are in our next example, and we're going to look at all three things once again. S&T, separation, as well as candle closures. What do we notice here? Do we have an S&T? Well,
[09:18] we have a couple right so you notice we take a look at this high here this asset has taken out this high you can see from this high over here we've taken out that high on this right asset
[09:32] so that is one smt showing strength in this asset weakness in this asset but we also have another one and this is going to show you that there are multiple smps across multiple different time
[09:44] sometimes. If you take a look at this high here, we take a look, we've taken it out here, where we haven't taken it out here. So we have multiple SMTs here. Both are telling us the same
[09:56] thing. This is the weaker asset. This is the stronger asset. Now, can we use separation here? Not to the upside, right? We don't really have it. These are trading relatively in the same spot on both of these upside retracements into a fair value up here. But what can we notice?
[10:12] we can notice that we have what taken out this low and we haven't taken out this low here which shows you what weakness in this asset strength in this asset does that candle closures tell us much
[10:25] no they're all relatively the same here so this would tell us what though where do we want to focus this asset if we are bearish right and so let's see if we get this continuation lower and we do get that trade lower right and you can see they're relatively moving the same way
[10:42] but you can also sometimes use candle closures, right? So you can see we're getting a little bit more strength here, but let's see what happens on these next couple candles here. So we can use candle closures.
[10:55] This is where now the strength has switched a little, where this is getting weaker while this is getting stronger. How can you tell that? Well, you can tell by the candle closures. This is a consolidation that's kind of remaining flat,
[11:08] while this one is getting a bit stronger, right? It's having more bullish closures. And so that tells you strength and weakness is not going to remain consistent all the time. Now this one's closer to the lows, right, so it gets it move towards these lows quicker.
[11:22] But this one in this area here I would say is weaker. So let's get into another example. So here we are in this next example, and we have a bullish bias because we have a bullish practical model here. Now just using this price action here, which one is stronger and which one is weaker, focusing on the upside move?
[11:40] So taking a look, there's not really a very obvious SMT in here, right? You can see here's this low. We kind of have the same structure on the downside here. This is where we can use separation And what do I mean by that Well take a look from this low here How close are we to that low or this low right So take a look at the structure there That the same as this one here
[12:04] And you can see, this is quite a bit further away than this one here. Or you could even use this low. It doesn't really matter which low you choose to look for separation. You can use multiple, right? You can use all of those there.
[12:17] So the separation is telling us what? this asset here on the left or gold euro is stronger now how else could you look at that well there's a few subtle cues but another obvious one would be this one hasn't taken out the high
[12:32] this one has so this is the stronger asset and so if you let that play out let's see if we can look at some candle closures here right and both kind of tell us the same thing but once again
[12:44] subtle things. This one is sweeping out the high, closing below, while this one is closing over the high, closing over its previous candle. So this is showing us the strength in gold euro over gold
[12:56] futures. But let's get into another example. So here we are in one more example, and let's combine everything together once again. So first, let's look for S&T, and what do we have? Well, you can
[13:09] take a look. Here's this low. You notice how we can't take out this previous low here. That is SMT. We can find the same low on this asset here and take a look. We have SMT on this low. This one
[13:23] is bullish, right? It is making a higher low while this one is making a lower low. But that's not the only SMT, right? We can take a look at this low. This one is all the way up there while this one
[13:35] has ran out its low here. So just using SMT, this one is propped higher. It is stronger. So I want to be focused on that one according to SMT. Let's say, for instance, we would use
[13:47] separation if we had this low and it was not yet taken out because then it wouldn't technically be an SMT, right? Because near asset has taken it out, but this one is propped so much lower to
[13:59] the low than this one. So putting that back where it was, what can we use next? Well, candle closures as well as smt if you notice on the upside here we're taking out highs that is far more bullish than being propped lower like that right let's take a look at candle closures
[14:16] you take a look at this thing below they're both bearish candles but what do we notice about the closures here right let's be specific this closure can't close below this down close candle below this low this one is closing below those down close candles right so that's showing you it's
[14:32] much weaker close now let's take a look at the next candle right this candle yes it's bullish look at it on this one it's bought all the way back up and closing over this down close candle and so this one is forming a continuation while this one is not yet reaching for the opening
[14:48] price of this down close candle we can tell that this is a stronger asset so if we want to trade it we'd rather focus on trading a stronger asset and you can see how it's getting that expansion Now let's see as we look this way forward, you can see, yes, we take out the high, right?
[15:03] And we do have a bearish candle here. This is continuing to the high, and then this one starts to catch up, right? But this is the stronger asset. Now, just in review, using SMT and then structure or separation between highs and lows paired
[15:19] with candle closures on correlative assets, you can determine the relative strength in which asset you should focus on. Now, this shouldn't be used alone, right? You want to have a higher time frame framework. You're not just going to be trading something because, oh, this one looks more bullish than the other.
[15:34] You still need a strategy behind it. But with that said, I hope you learned something. If you enjoyed it, please give it a like and subscribe, and I'll see you guys next time. Have a good one.
⚡ Saved you 0h 15m reading this? Transcribe any YouTube video for free — no signup needed.