
The Perfect Short Setup in a Downtrend
43sClear, actionable trading plan with specific entry triggers and risk/reward analysis appeals to traders seeking concrete strategies.
▶ Play Clip"Delivers a concise trading example but oversells with 'smart money' jargon; content is thin but on-topic."
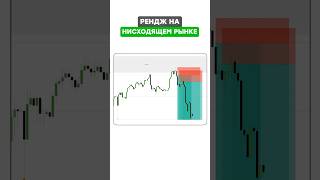
This video demonstrates a trading strategy for entering a short position in a downward trending market using price action concepts such as ranges, imbalances, and breakers. The trader outlines a plan to wait for the upper range boundary to be tested and an imbalance to be filled before entering, with a focus on risk/reward optimization.
The trader identifies a downward trend with a range and a key area of interest above. The target is the lower boundary of the range, and the plan is to wait for the upper range limit to be updated and an imbalance to be filled.
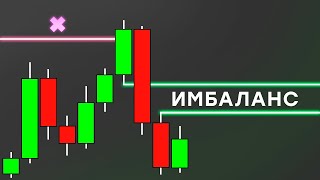
A short position is considered at the beginning of the imbalance. A limit order from current values would be placed at the start of the imbalance, with a stop-loss at the second candle's formation high and take-profit at the lower range boundary. Risk/reward is 1:1.8, which is not attractive, so the trader may pass or seek better potential.
The upper boundary of the range is updated, but this alone is insufficient. The imbalance must be rebalanced, and liquidity for purchase must be withdrawn. In most cases, the high will be removed later.
A real manipulation occurs: liquidity for purchase is withdrawn and the imbalance is partially filled. A candle indicates a potential reversal, as the price rose sharply then fell, forming a bearish M formation on the four-hour timeframe.
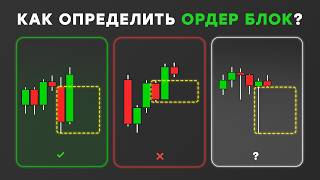
The M formation is confirmed with a true low update, breaking the structure. Bearish breakers form, providing a relevant entry for a short position. Entry from the breaker's beginning, conservative stop-loss behind the nearest high, and take-profit at the lower range boundary.
Another entry option is from the newly formed bearish imbalance, entering from its beginning with stop-loss at the high where the fall began, targeting the lower boundary. Risk/reward is 1:2.39. An aggressive option places a stop behind the breaker, yielding a final score of 1:3.
When the second position is filled, the lower limit is successfully updated, and both positions close according to plan.
The video illustrates a systematic approach to trading a range in a downtrend, emphasizing the importance of waiting for liquidity grabs and imbalance fills before entering, and optimizing risk/reward ratios.
What is the initial setup for a short trade in a downtrend?
Identify a downward trend, define a range, and wait for the upper range limit to be updated and an imbalance to be filled.
00:02
What is the risk/reward ratio that the trader considers unattractive?
1:1.8
00:28
What must happen before entering a trade according to the trader?
The imbalance must be rebalanced, and liquidity for purchase must be withdrawn.
00:41
What pattern indicates a potential reversal in this example?
A bearish M formation on the four-hour timeframe.
01:05
What is a bearish breaker?
A level formed after a structure breakdown where the price breaks a low, then retraces, creating a new resistance area.
01:18
What is the risk/reward ratio for the aggressive entry option?
1:3
01:58
Real Manipulation Identified
Shows the importance of recognizing liquidity grabs and imbalance fills as prerequisites for a valid entry.
00:53Structure Breakdown and Breaker Formation
Demonstrates how a confirmed structure breakdown and breaker provide a high-probability entry point.
01:18Risk/Reward Optimization
Illustrates the trader's discipline in passing on unattractive risk/reward and seeking better alternatives.
01:46[00:02] enter a trade. Roughly in a downward trend. I have already noted the reange and the key area of interest above it. The key target will be the lower boundary of the range. The plan is simple. We are waiting for the upper range limit to be updated and the imbalance to be filled.
[00:15] It is at this point that opening a short position will be considered. If we consider entry with a limit order from current values, then it will be at the beginning of the imbalance. Stoploss for the second candle his formation takeoff to the lower
[00:28] border of the range. The risk/reward ratio is 1 to 1.8, which isn't particularly interesting to me, so we'll either increase its potential or pass on this opportunity. The
[00:41] upper boundary of the range is updated. For now, this doesn't mean anything, because in addition to withdrawing liquidity for purchase, the imbalance must be rebalanced. Without this, it is impossible to enter into a transaction. In most
[00:53] cases, this high will be removed later. And here is the real manipulation we needed. At the same time, liquidity for purchase is withdrawn and the imbalance is partially filled. And this candle
[01:05] indicates a potential reversal, because first the price rose sharply, and four-hour time frame. In the current situation, a bearish M formation is forming. On this candle, it is confirmed
[01:18] because a true H low update is taking place. This is the breakdown of the structure. Bearish breakers have also formed , which currently interest, from which it will be relevant to consider a short position. Entry from its
[01:32] beginning, conservative stop-loss behind the nearest high, and take-profit at the lower border of the range. This candle shadow is testing the breaker, so the trade would have been filled. We can also consider another option for
[01:46] opening from the newly formed bearish imbalance. We enter from the beginning of the imbalance stop-loss high, where the fall began, to the lower border. R is 239.
[01:58] If we want to increase the potential, we can consider an aggressive option and place a stop behind the breaker. This will give a final score of 1 ktm. And now, when the second position is filled, the lower limit is successfully updated, and both the
[02:14] first and second positions are closed according to plan. M.
⚡ Saved you 0h 02m reading this? Transcribe any YouTube video for free — no signup needed.