

The Biggest Lie in Trading
45sOpens with a bold, controversial claim that immediately grabs attention and challenges common trading beliefs.
▶ Play Clip"Delivers on the promise of exposing a trading myth, but the repetitive examples and self-promotion dilute the impact."
The video debunks the common trading concept of market structure, trends, and fences, arguing that these are subjective and unreliable for predicting price direction. The creator, a trader with over $300,000 in payouts from funding companies, demonstrates with real candlestick charts how price often breaks structure, leading to losses. He advocates for a simpler, objective strategy: buying when price breaks a low and selling when it breaks a high, focusing on liquidity grabs and pullbacks in London and New York sessions.
The creator claims that the concept of market structure, trends, and fences is a lie perpetuated by pseudo-traders and course sellers who don't show real payouts. He argues that it's practically impossible to know where the market is going because different timeframes show conflicting trends.
On the 4-hour timeframe the price is bullish, on the 1-hour bearish, on 15-minute bullish, on daily bearish, on monthly bullish. This shows the trend is not clear, and relying on structure alone will never make you profitable.
Pseudo-mentors explain structure as higher highs/higher lows for uptrends and lower highs/lower lows for downtrends, drawing simple lines. But real trading involves wicks, false breakouts, and news candles that break structure, making it ambiguous.
The creator shows real charts of EUR/USD, his preferred pair due to high volatility and volume, which makes it less manipulated. He demonstrates how price breaks structure repeatedly, causing losses for structure-based traders.
Different traders mark the 'last low' or 'change of structure' differently (body vs wick, different timeframes), leading to subjectivity. When you lose, mentors blame you for marking it wrong.
On H4, price breaks structure with body and wick, leading to whipsaws. On H1, the 'samba dance' shows price breaking highs and lows, causing losses for those following structure.
On M15, the structure is even more chaotic, with price breaking structure in both directions, making it impossible to trade profitably based on structure alone.
The creator's real opinion: structure can be considered on daily/weekly timeframes, but not on lower timeframes like M15, H1, H4. Using lower timeframes leads to finding whatever you want, as you can always find a structure to fit your bias.
Price moves based on sessions, money, and news (NFP, CPI, FOMC). There are days when price trends strongly and days when it ranges. Structure is more confusing than helpful.
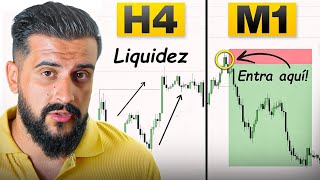
The creator's strategy: buy when price breaks a low, sell when it breaks a high, focusing on liquidity grabs at highs/lows in London and New York sessions, then entering on pullbacks. This has yielded over $300,000 in payouts.
A pullback of about 50 pips on H4 is more than enough for entries of 4-8 pips with stop losses of 5-8 pips, giving a 2-3R reward.
Market structure, trends, and fences are subjective and unreliable for trading. Instead, a simple, objective strategy of buying breaks of lows and selling breaks of highs, based on liquidity and pullbacks, can be highly profitable, as demonstrated by the creator's track record.
What is the main argument against using market structure for trading?
Market structure is subjective and unreliable because different timeframes show conflicting trends, making it impossible to predict price direction.
01:20
According to the creator, why is EUR/USD less manipulated?
EUR/USD has high volume and many banking transactions, making it difficult for any single entity to manipulate.
05:09
What is the creator's simple trading strategy?
Buy when price breaks a low, sell when price breaks a high, focusing on liquidity grabs and pullbacks in London and New York sessions.
22:27
How much has the creator withdrawn from funding companies?
Over $300,000.
20:36
What timeframes does the creator suggest structure might be useful on?
Daily and weekly timeframes, but not lower timeframes like M15, H1, H4.
18:57
Conflicting Timeframes
Illustrates the core flaw of structure: different timeframes give opposite signals, making it impossible to have a clear trend.
01:20EUR/USD Less Manipulated
Explains why EUR/USD is preferred: high volume reduces manipulation, a key fact for forex traders.
05:09Objective Strategy
Provides a concrete, simple alternative to subjective structure, backed by a track record.
22:27[00:03] lie that is still being told in trading today. I'm going to talk to you about something I keep hearing about, and that's the structure, the fences, or the trend of the market. I constantly hear from pseudo-traders and
[00:19] pseudo-mentors who don't even teach you about payouts or withdrawals from funding companies, which proves that they are really just course sellers and not profitable traders. Because if they had withdrawals and payouts, funding companies,
[00:33] they would show it to you, but the point is that they never do. But unfortunately, since there are so many people like this, they fill the heads of this, they fill the heads of people
[00:48] who really want to learn from profitable people with lies and nonsense. Many people talk about market structure, trends, fences, all these kinds of phrases to make you feel like a bad trader if you don't know where
[01:04] the market is going. And in this video I'm going to reveal to you that the structure, the market trend, the fences, it's practically impossible to know where the market is going. Because? Well, for a simple reason: on the
[01:20] 4-hour timeframe the price will be bullish, on the one-hour timeframe it will be bearish, on the 15-minute timeframe bullish, on the daily timeframe bearish, on the monthly timeframe bullish, on the daily timeframe bearish, on the monthly timeframe bullish, so the trend is not clear and you will
[01:33] never make money if your trading strategy or plan is based solely your trading strategy or plan is based solely on correctly predicting that market structure. And I'm going to reveal to you with various examples throughout this video how if you
[01:46] throughout this video how if you only focus on the structure you'll never be profitable. But hey, this is nothing new. If this is explained by a trader who isn't profitable—well, a so-called trader—how are you going to be
[01:58] profitable? If the person explaining it to you doesn't withdraw a single euro or dollar from funding accounts, funding companies, or trading, how can you possibly listen to them? But anyway, since I know there's a lot of talk about
[02:10] trend and all that kind of stuff, let's really explain it and let's really explain it and see that this is a big scam and a big lie. What's the first thing we're going to look at? Well, since the vast
[02:23] majority of pseudo-mentors and pseudo-traders explain the structure in this way, right? They say that when the price is respecting an upward trend, when it is respecting higher highs or higher lows
[02:38] , then the price is in a clear, upward trend. And on the other hand, when the price creates lower highs and lower lows , then the price would be in a structure, in a
[02:52] trend, in a bearish fence. They draw it for you with three lines, three lines where, well, it's as simple as drawing it here, okay? It's as easy as doing this and your pseudo-mentor, your pseudo-trader, tells you that he will see an
[03:07] upward trend. We'll go into detail about this later, and we'll see how four lines you draw here aren't enough for this explanation. You have to show it to me, you have to explain it to me with real examples, with
[03:21] real trades and with real Japanese candlesticks, because this is all very nice, but when you go into real trading, well, it's never like that. You're going to see well, it's never like that. You're going to see wicks, you're going to see false breakouts, you're going
[03:34] to see very strong upward impulses and very strong downward impulses, you're going to see news candles, which are going to break structure because they're going to break many highs, many lows, and you wo
[03:47] n't know if that news candle counts, if that news candle doesn't count, if now, since that news candle has broken upwards and is bullish, or if it was just a liquidity collection, since there are so many unknowns, what
[04:00] they do is put this little drawing here. They draw it for you with four lines, four telling you that they are profitable when they never teach you anything. They show you these four lines and tell you, "No, you buy here and you sell here." And you,
[04:13] how are you? So he shows you all that paraphernalia, and you believe it. And in the real market you'll see how in 4 hours it will be going up, in one hour it will be going down, on a daily basis you're in the middle of a range and that's the reality, right?
[04:26] Four lines here and a graffiti here. painted on the screen. But anyway, because I am going to give you an explanation and make it clear that the issue of structure, fences, trends and that kind of thing
[04:40] really in the vast majority of cases serves no purpose other than to confuse and mislead you. Let's now look at real examples, with real Japanese candlesticks, and we'll see that what they tell you about structure and what they tell you about
[04:55] fences is mostly useless . Well, yes, to make you waste money and time. Here we are in the Eurodollar. As you know, I personally only trade the euro/dollar pair, and that's basically because it's the
[05:09] currency pair with the most volatility , the highest volume, and the most banking transactions, making it the
[05:21] within all the manipulation we experience today in the markets, in world. But within the currency pair, within Forex, it is the currency pair that has the least manipulation, and this
[05:33] basically has an explanation: it has a lot of volume, so just one person, just one entity, just one bank, just one institution, just one market, but rather there will be several
[05:46] investment funds behind a movement. Keep in mind that the lower the transaction volume, the easier it is to manipulate, because if I put in x million I can move an asset that nobody knows about, but you're not going to move the eurodollar
[05:59] because there's a lot of money behind it and it's very difficult to manipulate, manipulations that exist. You already know that everything is absurdly manipulated. Well, we can already see here that our little drawing, which our favorite guru has shown us, is
[06:13] taking a penny away from funding companies. So here, as resembles it, okay? We are looking at the daily timeframe, which is supposedly the timeframe where we will see the greatest clarity, because if I go down to 15
[06:25] minutes or if I go down to an hour, your head is going to explode, because you are going to see 300,000 structures, 300,000 fences and 300,000 stories that they tell you to sell you the idea. What do
[06:37] daily timeframe and we see that the price, according to our trusted guru, is in an upward trend, an upward trend where, in last impulse, okay? The final push comes from here. Now I'll
[06:52] also get a lot of pseudo-traders who have never withdrawn from funding companies or anything and they'll tell me that the strong minimum comes from here, okay? Well Therefore, the price will continue until the last low it breaks here, so in theory nothing
[07:06] should happen. Okay? Here comes the first inconsistency. Because? Well, because many traders who analyze the structure for their trading plan will tell you because it is the last impulse, and some will tell you that it is here, some will tell you
[07:20] that it is here, some here and some here. What's going on? That we are already basing ourselves on subjectivity. And when you lose a trade you'll say to your favorite mentor, it's not like the structural change was down here. You shouldn't
[07:32] have looked for sales, you shouldn't have looked for purchases. Why are they doing this? because nobody is going to tell you if the minimum is here, here, here, here or here, what's going to happen? That when you fail they'll tell you it's your fault for not
[07:46] having the minimum properly marked in that structure they've invented. Well, if you mark the change in structure here, which I'm telling you, it would be the impulse wants, but some structure lovers will come
[07:59] and tell me no, that's not it. Okay, fine. The structural change would be here, the last low that creates the momentum, okay? Here, the price breaks with the "No, the change in structure is with body." No, the structural change is
[08:12] with a wick. With body and with wick in what temporality? Because it has body in daily use , maybe it has a wick in weekly use , maybe it has a wick in daily use, maybe it has body in 4 hours. Where were we? Body
[08:24] wick, 4 hours daily. What can I base a structural change on? Well, they won't be able to answer that either. The price, theoretically on a daily basis, this minimum. And here we would look for sales. What happened? Because,
[08:37] according to your favorite guru, this is already a sales trend, right? Start making sales, sell your house, pawn your car, pawn your watches and keep making sales because this is going to hell and you're going to be a multimillionaire because you've discovered
[08:50] the perfect strategy. Well, as always, structure does not follow price. Here you'd look for a sale, boom, boom, boom, and it breaks you again. If you're a swing trader or something similar, or if you rely on structure, it would have already
[09:05] blown your daily structure because you thought it was going to sell fall, but continued to rise. But that's not all, here's another example. We see how the price creates a minimum for you. You cannot observe from here. And it
[09:19] creates a minimum, boom, it breaks you. And you would say, "No, this is bullish, the last low is being respected." No, it breaks the minimum. Boom. And not only that, but it raises you again . We would have another mistake. Okay? Here we have several
[09:32] errors where the price breaks you . Here, for example, it breaks the stop sign and goes back down. Okay, you'll see another example here. It decisively, the last low to create momentum and it rises again. Again,
[09:46] many defenders of the structure will tell me that well, I'm applying it keep applying the structure that probably won't get you anywhere , alright? But anyway, let's get on with it. 4 hours, 4-hour time frame. Here we
[10:01] are seeing how in daily, well in theory we were bearish, okay? We were on the downswing, we were coming from up here . Boom, boom, boom. Okay, let's go further . 4 hours, 4-hour time frame. What do we have here? Well,
[10:15] theoretically the price is in an upward trend, okay? In 4 okay? We're going to go by time periods. Here we see a bullish structure in the 4-hour chart, and as we can observe, the price breaks through with a body.
[10:28] We're already bearish here. Benjamin is looking for sales. Okay, high, boom, and it takes you to the top. Wow, he's done it to me with a wick. What am I going to do? Bullish, bearish, or do a somersault. Well, I'm bullish. I'm going to look for purchases here at the 50%
[10:42] Fibonacci level because my favorite mentor told me to, and also because I'm a eat it again and your favorite mentor tells you again that you're applying the strategy wrong. Hey, are you applying it wrong? No, not by applying it incorrectly, mate, you
[10:55] cash again. Hey, now that I'm bearish or bullish, you don't even know what timeframe you're viewing it on anymore. Liquidate at the minimum, then go back up. In theory, we should look for sales or not, because they are wicks. They won't be able to
[11:09] tell you either. The new minimum creates another impulse, it breaks it with substance. In theory, we'd be looking for sales, right? Up again. And it would liquidate the maximum mentioned to you. He'll wipe us out, boom. Already. In theory, the price is
[11:23] bullish again because it has broken out on the daily chart with a body. Okay, it broke my heart. Well, here you can see the rejection that the price increase has just given you. If you're looking to buy things, you're probably eating it.
[11:36] done is absorb the liquidity we have up here and start that decline. Why instead of looking for shopping at I don't know where? Because as you can see, offset by the price. A low, even if it's a bullish candle, this is a low.
[11:50] low here with this candle, boom, and creates the rise. This low has already been blown through by last low in 4 hours before the surge. Where are we now? a downward trend, an upward trend, or a liquidity collection, because well, in the last few
[12:04] . This is where the low salary broke me, I looked for sales and I got stuck with it. I looked for sales here and I got caught out . I looked for shopping here and ate it. All the examples I've been showing you, well, the price hasn't been
[12:17] respecting that structure. Look at the messed-up structure we'd have here, right? purchases. Where do I put the sales? Where do I sell the purchases?" In theory, I should look for buys, I'll eat it. Here, when the price breaks upwards,
[12:31] I should look for buying opportunities again; I'll get caught out again . Here, when the price . Here in this example, it also breaks with body, I'm looking for sales, I'll eat it up . Here, it also breaks my structure for 4 hours, I'll eat it. The price here is
[12:45] daily purchases. I'll eat it again in 4 hours. Here the price breaks this minimum and recovers. Here the price breaks this high on the H4 chart. I should look for shopping.
[12:57] n't know if it will go down or up because right now, as video, things are a bit unsettled because of the US government lockdown. volatile, there probably aren't any high-impact news events like in FPCPI,
[13:10] can see the 4-hour daily structure. If I okay? Look at the structure we would have here, okay? Here we see how the price breaks the high. I'd look for shopping, wouldn't I? If you put your stop sign here, you would have already
[13:24] eaten it with chips. We'll go further in an hour. Let's see. Look at the samba dancing we have here. I call this samba dancing. The dance of money, it breaks you up top, it breaks you down bottom. You sell here because you think
[13:37] goes up. Here you buy because you think it's going to keep going up, but it does n't, and it goes down. Look at the way the price is fluctuating there. Here, this last minimum hasn't broken on me either . These are sales. Upward strand. Once again, it was taken out and once again
[13:53] liquidated with that damned structure. Further on . Look, let's see how you would see it. Okay, look here, for example, another example we have here. Here we see how the price is per hour, right? This maximum creates a minimum for you,
[14:07] boom, you're looking for sales, okay? In other words, your favorite mentor, your favorite guru, who anything else. This is a joke, okay? Many of you, you know, then tell me in the comments, "No, it's just that you have a big ego." A little bit of grace, gentlemen, please, a little bit
[14:20] of joy. The boring term needs a little spice. He's looking for a minimum. Here we're looking to increase sales . Another elimination and another challenge lost. Now I'm looking for purchases that have been closed to me with a body up top
[14:32] Okay, I hope you're understanding the examples; I'm not going to draw everything because if I don't find a buyer, I won't eat it again. Now it's sales. Buy now. Now on sale. Now I don't know if I should do a somersault or go to
[14:44] because it's closed up top with a body. It's killing me. Now it's rising again. I am looking to sell. Now I have to look for a purchase. I don't know anymore whether I should look for a sale or a purchase, or if I should do a handstand. Here, it might break the
[14:59] minimum. Just look, it's a joke. This whole structure thing is a basing their opinion on the structure because, really, look, this minimum is what breaks the maximum, okay? Many, even when the price breaks up,
[15:13] time frame and so on, well, many go down to 15 minutes, to 30 minutes to look for an entry. Hey, it's blown me away . Well, these are the ones that those wick would seek, which some of you will tell me, "No, it's always with body." Well, that's what
[15:26] the wick break into account. So, believe me, a into account, right? Not just with body. Here you would look for sales, or of course, sales because, well, when you broke up top you would look for purchases and now
[15:41] that you're broken down below, you would look for sales and now you're stuck with it. Okay? we are looking at H1, H4 and daily timeframes. If we go to M15, this is Imagine this: you're in a bearish structure, your favorite mentor has told you to
[15:56] place a Fibonacci retracement here in the Golden Zone, and you say, house here right now. I'm going to pawn my Lamborghini here, buddy. Stop-loss again." Okay, as I said, we are analyzing daily cases of H1, H4
[16:10] wonderful structure we have here, gentlemen. Look. This is the same as this, our guru taught us. This is what we bought on AliExpress and this is what put in here, gentlemen. When the price here breaks you, what am
[16:24] I supposed to do? Should I look for sales, purchases, or go buy should do here. Or here too, what is the maximum of this bearish impulse? This one up here, or this one that 's the last pause before falling? Well,
[16:37] because he has no idea. So, he has no idea. Here the price might go up in 15 minutes. Boom, the samba dance brings you down and then up again . We're going to see more samba dancing here. Likewise, take a look. Do
[16:51] you think this is the final low? Hey, I'm going to throw my Fibonacci here. Look, let's see what a structure trader would do. We're going to put M15, okay? M15 is bullish, M5 is bullish. I'm going to throw away my Golden Son. This is my
[17:03] bullish structure. This is my ultimate carrot. This is my minimum impulse. And I'm going to put my entry in the Golden Song, on 0.6 0.7. Because? I don't know and I'm going to listen to him because he has a Lambo and I don't. I'll put the
[17:18] shopping in here. I'm leaving my order limit. Wow, they've brought me up again. Well doing this here in a somewhat jocular tone, in a kind of playful tone, right? So, well, so as not to take it so seriously, guys. Honestly, the structure, and I'm telling you
[17:33] , look, another other other structure. Here we see how the price. It breaks us up with a fuse. Here with a wick, okay? Look. Wick and wick. What are you looking for there? Okay, the price here is the same , look, it breaks the minimum. In
[17:46] the price is bearish because it has broken the downtrend again, right? The tell you. And here you can see how the price, when it breaks a high, goes down, and when it breaks a low in this case, it goes up. Many will say here,
[18:02] "No, here he broke us with a body down in H1." Therefore, I'm going to throw my Fibo from the highest point the fence has created and in my Golden Song I'm going to throw an entry. Okay? Well, mate, you're going to be
[18:17] probably go to the SN because look at the price recovery, almost practically 90 and something, okay? And in the end, the price, here, it finally broke the maximum, okay? Because this is the backtech we
[18:29] 're doing. Notice that I end up breaking that high and many here would look for sales because it has broken the last low and is going to sell, right? And now mind a little, okay? So you can think about it , so you can really consider whether
[18:44] . Okay, now seriously , seriously, seriously, seriously , because many of you take it the wrong way and some of you are being really rude. I'll have take this a little bit lightly and make it a little fun. Let's
[18:57] see. Structure, yes or no? real opinion, neither yes nor no. You can keep it in mind daily, weekly, but little more than that. If you start looking at structure in M15, in H1, in H4, in H2, in M5, which I'm seeing a lot of gurus doing now and those
[19:11] seeing a lot of gurus doing now and those timeframes of H2, H3, M45. Let's see, if you go to M5, if you go to M15, if you go to M2, if you go to H3, ah, of course you're going to find a change in structure, of course you're going to
[19:23] find a liquidation. Because? Because you keep beating around the bush. In other words, if you want to find out if the price is related to sales, you have 200,000 time periods to see what is related to sales. In other words, if I now set myself to H1,
[19:37] H2, half an hour, 25 minutes, 22 minutes, I mean, here I can . Look, 22 minutes, here I am already in the 22-minute time frame, I , I can go to the 25-minute time frame. In other words, if I want
[19:54] to find a structure, a rising or falling fence, because I want to sell or words, you'll find that the price is either rising or falling. You'll find whatever you want in the market. Because? Because you can
[20:06] . So why don't I think structure, fences, and trends are ultimately, the price does what it wants. The price goes by sessions, it goes by money, it goes by the big news that comes that day by the NFP,
[20:22] by the CPI, by the FOMS and there will be moments in the day, there will be days, there will price will go in only one direction and it will not care about your structure. There will stays very range-bound and you don't know if it's bullish or bearish, and what you're going to
[20:36] words, the structure, in my opinion, with the years I've been here, which are now almost 8 years, and again more than $300,000 in payouts with funding companies, which I'm going because this is the reality. My experience throughout this time and in
[20:51] all these withdrawals with my trading strategy and with many hours in front more to confuse you than anything else. I personally don't even use the structure these days if the price is rising or falling. If the price settles me at a
[21:05] , I look for buys. If the price reaches a maximum on the reaches a maximum on the H4 H1 daily/weekly timeframe, I look for sales. And shown here. In fact, you can see that the price, look, here
[21:19] we have the price, okay?, breaks a maximum, it's sales. It breaks you a minimum, it goes shopping. It breaks a low, a pullback in purchases. It breaks a high, a drop in sales. It breaks a low, a pullback in purchases. It breaks
[21:34] a low, a pullback in purchases. It breaks a low, a pullback in purchases. You'll very small." Well, let's see, there's a very small setback. Okay, so you can see that this pullback in 4 hours is, let's see if it lets me put it, it's
[21:48] 50 pips. Given that my entries usually turn out to be between 4 and 8 pips, that's more than entries usually turn out to be between 4 and 8 pips, that's more than enough for a 4c, okay? And this is the structure I use. This pullback of about 50 pips is
[22:01] more than enough to make money, considering that my stop losses are usually between 5, 7, and 8 pips, so it easily gives me a 5R. And I'm not going for a 5R, I usually go for a two to a three, so that's more than
[22:14] enough for me to make money with that pullback. To finish the video, let's just simplify. I personally don't use market structure or take it into account. I only take into account when the price manipulates a
[22:27] high, when it manipulates a low, in the London session or the New waiting for liquidations at highs and waiting for a pullback that usually occurs , statistically the price
[22:40] low, tends to pull back and that's where I look for my entry. Something as objective, not subjective, as structure; structure is very subjective. This is the objective trading strategy. Hey, break a stop sign, I'm selling. Hey, break the
[22:55] minimum, I'm in. That's my trading strategy: buy when it breaks a low, sell when it breaks a high. And with that trading strategy, only and 2.5 hours in the New York session, I have withdrawn more than $300,000 in
[23:08] payouts with funding companies. And I'm not like your favorite guru who shows you cars, but never teaches you about payouts or funding withdrawals. And with this simple and objective strategy that I operate with, and with that
[23:21] little time, well, I have achieved everything I have achieved. That's great! If you want to follow me on Instagram, well, there you have it. By the way, you can find it below in the description, and there you'll see dozens and dozens, probably even hundreds,
[23:34] of withdrawals with the simple strategy of buying when it breaks a low and selling when it breaks a high. I hope you enjoyed this video that is the fence structure and the trends that many people talk about, but
[23:49] doing because practically nobody who shares content is profitable. Very share content and are profitable, and that's why I like to occasionally reveal and show you that the vast majority of what you're taught is useless.
[24:03] Well, yes, to waste your time and money. I hope you laughter, putting a little bit of a fight charlatans and fools. And that's all, I hope I've helped you even a
[24:16] little bit, and I'll see you in the next video.



⚡ Saved you 0h 24m reading this? Transcribe any YouTube video for free — no signup needed.