

Stop Guessing Tops and Bottoms
43sDirectly addresses a common trader frustration, promising a mathematical solution to a gut-feeling problem.
▶ Play Clip"The title promises a step-by-step guide to the Dave Landry setup, and the video delivers exactly that with clear instructions and examples."
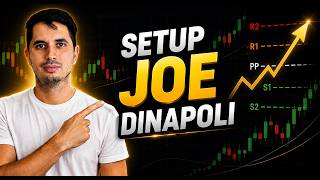
This video explains the Dave Landry trading setup, a trend-following strategy that avoids predicting tops and bottoms. Instead, it focuses on entering trends during pullbacks when the correction exhausts itself, using three moving averages to confirm the trend direction.
The market is about applied mathematics, not gut feeling. The Dave Landry setup helps traders ride trends with controlled risk.
The setup does not predict trend starts; it aims to stay in the trend. Pullbacks are like an athlete resting before continuing.
Three exponential moving averages (20, 50, 80 periods) are used to identify strong trends when aligned.
Look for a candle with a lower low than the previous two candles. Enter at the high of that candle, stop loss at its low.
The exit target is set at two times the risk (distance from entry to stop loss). Example: entry at high, stop at low, target at entry + 2x risk.
For short trades, look for a candle with a higher high than the previous two candles. Enter at the low of that candle, stop loss at its high.
A short trade yielded a profit of 950 points with a stop loss of 200 points, demonstrating the risk-reward ratio.
The setup is a tool; consistency comes from disciplined application and execution. Stop searching for magic strategies.
The Dave Landry setup provides a systematic way to trade trends by entering on pullbacks, using moving averages for trend confirmation, and maintaining a fixed risk-reward ratio. Discipline in execution is key to consistency.
What are the three moving average periods used in the Dave Landry setup?
20, 50, and 80 periods, all exponential.
02:06
What indicates a strong trend according to the setup?
When all three moving averages are aligned and pointing in the same direction.
02:50
What is the entry trigger for a long trade?
A candle that makes a lower low than the previous two candles.
03:20
Where is the stop loss placed for a long trade?
At the low of the trigger candle.
04:00
What is the take profit target for a long trade?
Entry price plus two times the risk (distance from entry to stop loss).
04:42
What is the entry trigger for a short trade?
A candle that makes a higher high than the previous two candles.
08:48
Where is the stop loss placed for a short trade?
At the high of the trigger candle.
09:00
What is the take profit target for a short trade?
Entry price minus two times the risk.
09:15
What is the key to consistency in trading according to the video?
Discipline in applying and executing the setup with regularity.
10:28
Market is Applied Mathematics
Shifts mindset from gut feeling to systematic approach.
00:16Continuity Setup Analogy
Uses athlete rest analogy to explain pullbacks in trends.
01:14Two-for-One Risk-Reward
Fixed risk-reward ratio simplifies trade management.
04:42Discipline Over Magic
Emphasizes consistent execution over seeking new strategies.
10:28[00:03] to open your manual. I am Lis. And I am Ricardo. And you've probably already tried to guess where the top is and where the bottom is. And the problem is that by trying to guess, you end up operating against the dominant market force and
[00:16] mercy. Today we're going to teach you that the market isn't about gut feeling, but about applied mathematics. It's David Landry, created by one of the biggest names in American trading. Guess who? David Lendry. That
[00:31] wise, unbalanced [ __ ] was crazy, man. The goal here is simple. Stop being taken for a ride and start riding the trend with a risk- in your pocket. If you like us and you like David
[00:46] Lendry, subscribe to the channel, click like, and let's get to the video. members' area. Members, each level has its own advantage. See if you like any of the
[01:01] genres, check out early videos, some videos will only be available to members. So, take a look there, see if you find it interesting, if it's good for you. Sure, it will help our channel grow even more, and we'll be
[01:14] able to reach and help more people. David Lander is a continuity setup. We don't want to predict when a trend will start, we just want to stay in it. We want to go inside during our
[01:26] break. Imagine an athlete, he's out there running and everything, he keeps going and gets tired. He needs to rest a little, relax, and then after that rest, he can go back to running with force. And this rest period is what we call a
[01:39] When the price is stretched too far, it deviates from averages. Right now, the most opportunistic sellers are trying to push the price down. And this is where our David Land setup comes in. It indicates the exact moment when these
[01:53] sellers will give up, and then the main trend will regain strength. We don't buy into the euphoria, we buy into the exhaustion of correction. we right-click here, and
[02:06] then we go to indicators. Let's set up three moving averages. So we're going to take moving averages. So we're going to take the average of 20 periods, the average of 50 periods, and the average of 80 periods. So, three averages in the graph. I'm going to take
[02:21] the average of 20 exponential times and add a color that I like. and add a color that I like. Our average of 50 is also exponential. I'll leave it this color. And the average of 80 is also exponential.
[02:36] 80 is also exponential. Purple here. Perfect. So, what will these three averages be used for in our Dave Landry setup? It will serve as a trend indicator. When they're all pointing in the
[02:50] same direction, right, aligned, perfectly, that signifies a strong trend. So that's where we're going to look for that pullback, which is what his setup does, and make the entry, okay? So, let's take a look here. Here, the three lines are
[03:05] aligned. You can clearly see the beginning of their alignment here, right? beginning of their alignment here, right? So, what's his setup, right? So, what do you do to activate the setup? We need to look for this to
[03:20] need to look for a candle that makes a lower low than the last two candles. So, what would be the minimum, right? It's the wick's low point, not the candle's low point, not this low point here, it's really the low point, the absolute low point
[03:34] , right? No, the minimum closing price in this case, right? So that. So, for example, here, he actually made a low score below that, but it was only one. We need two minimum wages. So, we're going to look here,
[03:47] see. For example, this candle here, it made a lower low than the last two candles, didn't it? So, this candle here triggers the setup. And what this candle here triggers the setup. And what would the setup be? We enter at
[04:00] would the setup be? We enter at its peak and then the stop loss occurs, right? It's at its lowest point. Oh man, but that didn't happen here. It really did n't happen. So in the next candle here, it also made a lower low than the last two lows. He did.
[04:13] We'll bring down our setup. So we come here, look. Stop here and the entrance would be at this point. It didn't work out again, did it? The next one that didn't reach our entry point here, but the next one also made a lower low than the last
[04:28] two. Then again, it activated our setup. So our stop is here. And our entry point is here, right above, at the high of the candle that triggered the setup. And with that, we make a two- for-one deal. So let's click here,
[04:42] entry here, stop here. And our two-for-one, our exit, was exactly at this point here. Super simple. Let's see if there's another type of entrance further down the line, folks. Just
[04:57] a minute. Many people come to us and ask if we have any platforms to recommend, whether it's a brokerage or an exchange. Well, we have some great news for you. The Trader's Manual now has a partnership with
[05:11] BingX, one of the top 10 exchanges in the world. We chose this exchange because it's perfect for beginners, and especially for those who want to access the main global markets through Bing X Trade F. With a single
[05:25] account, you can trade more than just crypto, my friend. You can trade gold and silver, for example, the main pairs in Forex, and even trade stocks in the United States, such as Nvidia and Tesla, with low fees and high liquidity. And imagine
[05:42] yourself trading with leverage up to 500 times on commodities, Forex, and indices like the SP500. Yeah, that's sure to put an end to risk management, right? So let's take it easy. You're not going to just go
[05:56] in and do it 500 times, are you? Let's take it easy. And the Bing X platform has a demo option. You can test all your setups there without having to spend real money. It's a virtual currency there that you use to test
[06:10] everything you need. So let's take it easy, as we always say, important part of trading. And if you don't want to trade alone, you have the option of copy trading, where you can automatically copy the best
[06:24] traders in the world. The interface is entirely in Portuguese and, on top of that, it's integrated with TradingView. And for those who don't know, TradingView is the most widely used platform in the entire world. You can register using this link
[06:37] . In addition to having great benefits, it will help our channel grow. And if you click on that link, you'll see that there's more to it than that discover on the website page. Click there and claim your bonus.
[06:50] And speaking of bonuses, until July 30th you'll get 0% of the FIP fee. For those of you who trade fairly frequently, you know that this fee isn't cheap, my friend. So,
[07:02] until July 30th, 0% fee. And if you want reliability, know that Bing X is an official partner of Ferrari, yes, Luis Hamilton, of Ferrari, yes, Luis Hamilton, Charles Declect, and we also have Chelsea
[07:15] as one of Bing X's main partners. For those of us who need risk management and security in our operations, know that Bing X also cares about you. So, click here below and register with Bing.
[07:28] We can see it here, look. This candle here didn't make a lower low than that, so it's pointless. This one won't work either. Hey, he did it here. This would be an entrance. Just look. Let's put it here. Place it here. What happened? This candle
[07:43] here made a lower low than those two, right? But look, this place wasn't we do? Let's move on to the next one. The next one had a lower low than the last two. It made a lower low, so enter at the top of it,
[08:05] exit, our stop loss just below, two to one. So we come here, to one. So we come here, entry up here, exit down here, and look, our profit up here was a profit of 418 points. I didn't even see the
[08:19] other company's profit, but it was definitely higher than this one, right? Of course. So that's it, it's going to happen several times throughout the day. If you look again, it will happen again. Here, for example, it happened. If I hadn't gotten into
[08:32] . I would have put a minimum here, the entrance here, and the exit here. It didn't happen. Next here, it worked! Entrance here, minimum down here. We had another game here a little further up. So,
[08:48] throughout the day you can perform various operations, some are successful, some are unsuccessful. So, part of the process is testing and seeing what happens, right? So, for the sales setup it's the same thing, only in reverse. So, we're going to look for
[09:00] a high that's greater than the last two highs and position the entry and exit points accordingly. So, let's go. This one made a higher maxim than the last two, did n't he? So here we would enter with a sell order, and here the stop loss didn't trigger in the
[09:15] next stage. Same thing here. He managed to make the peak bigger than the last two peaks, but it wasn't activated. Next. Same thing. It was not activated. Same thing, it wasn't activated. Same thing. Oops, it's activated now. It triggered the trade and then
[09:32] triggered a stop loss. Our game was supposed to be right here, but it came and hit us. It's part of the process. It lost a little bit. However, in our next trade, which also had another triggered another entry point for the next one; it
[09:47] would be a sell order here and a stop loss here. Was it triggered? It was not activated. Let's move on to the next one. Stop up here. Enter here. Look,
[09:59] now it's been activated! So let's put our stop right up here . Our entry is on the next candle. Of course, right, on the breakout, right, of Ken, and we did manage to make a profit, and a very good profit, right, of almost 950 points.
[10:16] So, yes, we had a stop loss of 200 points and a profit of 950 points in this setup. So, I hope you like this setup. Since it's a
[10:28] very old setup, take a look, study it, not just on our channel, you can study it with three good ones. Remember, the setup is the tool, but consistency comes precisely from the discipline of applying the setup and
[10:42] executing it in the same way, with some regularity. Stop searching for magic strategies and start rigorously executing the correct technique. If this content brought you clarity and made your life easier, give it a like, subscribe to
[10:58] our channel, check out our Instagram, comment below if you have any questions, and this video will definitely help you achieve more regularity and consistency in your trades. Until next time.

⚡ Saved you 0h 11m reading this? Transcribe any YouTube video for free — no signup needed.