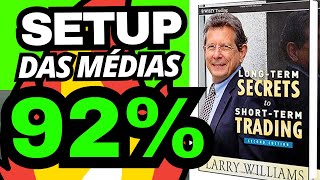

92% Win Rate Strategy Revealed!
60sThe promise of a 92% accuracy rate immediately grabs attention, and the visual capital curve makes it compelling.
▶ Play Clip"The title promises a 92% accuracy setup, and the video delivers exactly that with detailed backtest stats, though it's a bit repetitive and ends with a promo."
This video presents a swing trading strategy for daily stock charts that uses a simple envelope of two moving averages (five-period high and five-period low) to generate buy signals. The strategy claims a 92% success rate on the EG3 daily chart, with a target of 1% and an emergency stop-loss of 8%, and includes an alternative exit signal based on the upper envelope line.
The strategy uses an average of five highs and five lows (simple arithmetic averages) to form an envelope on the daily chart. It is designed for swing trading with a high success rate.
Buy signal occurs when two consecutive candles close below the moving average of five lows. The analysis is done about 10 minutes before the market close, including the current day's candle.
Once the entry condition is met, enter a buy position near the market close with a target of 1% and an emergency stop-loss of 8%. The stop is placed far away to avoid being hit, as there is an alternative exit signal.
If the market fails to hit the target and doesn't trigger the stop, but closes above the upper line (moving average of five highs), the trade is closed. This allows exiting with a smaller loss than 8%.
On the EG3 daily chart, the strategy produced 286 trades with a profit factor of 2.87, a 92% success rate, a payoff of 0.22, and a drawdown of 7.79%.
Using a 2% target reduces the success rate to 82% with a profit factor of 2.20. A 3% target also works, but the 1% target is ideal for a very high success rate.
The strategy also works on other daily charts: EQTL3 (232 trades, 90% success, profit factor 2.58), Vivit3 (273 trades, 89% success, profit factor 2.83), and ITSA3 (319 trades, 88% success, profit factor 2.11).
The strategy is a simple, rule-based swing trading system that relies on a two-candle close below the lower envelope line, with a 1% target and an 8% emergency stop. It shows consistent profitability across multiple stocks, but traders should test and adapt it to their own instruments.
What is the entry condition for the swing trading strategy?
Two consecutive candles close below the moving average of five lows.
01:15
What are the target and stop-loss levels for the strategy?
Target of 1% and emergency stop-loss of 8%.
03:11
What is the alternative exit signal if the target is not hit?
Exit when the price closes above the upper line (moving average of five highs).
03:53
What is the success rate and profit factor on the EG3 daily chart?
92% success rate and profit factor of 2.87.
07:51
How does the success rate change when the target is set to 2%?
The success rate drops to 82% with a profit factor of 2.20.
09:01
High Success Rate Claim
The strategy claims a 92% accuracy on the daily chart, which is exceptionally high for a trading system.
00:20Alternative Exit Signal
The exit signal based on the upper envelope line allows traders to exit with smaller losses than the 8% stop, improving risk management.
03:53Backtest Statistics
Provides concrete backtest numbers (profit factor, drawdown) that validate the strategy's performance.
07:51Applicability Across Stocks
The strategy works on multiple stocks, showing its robustness and potential for broader use.
09:33[00:20] share with you a strategy that has a really great capital curve . As you can see here, this setup has a Today, specifically, I want to share with you a strategy
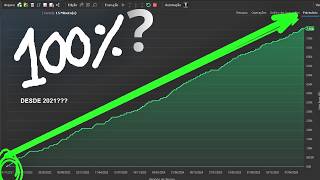
[00:33] for the daily chart, for the daily stock chart, that has an excellent success rate. Look at that, 92% accuracy on EG3, daily chart, extremely upward-sloping capital curve, right? To implement this strategy, we'll
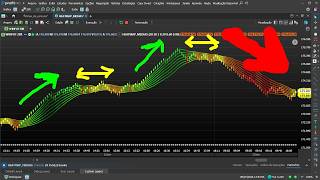
[00:48] To implement this strategy, we'll need an average of five highs and an average of five lows. Both averages are arithmetic; they are simple. It's basically an envelope that we're going to need, right? An envelope of media.
[01:02] So you'll have an average of five highs and an average of five lows. You put that on your chart and based on those two averages, we're going to make buy orders on the daily chart. Please note that these are
[01:15] purchase operations in the form of swing trading. Today I want to share with you a swing trading strategy with excellent statistics. This strategy will work as follows. I need two
[01:28] consecutive candles that close below the moving average of the five lows. And I can include today's candle in the analysis. For example, in this case, you can see that the candle on April 2nd was the signal candle, and it was
[01:43] counting as a candle that closed below the moving average of five lows, because I'm going to do the analysis about 10 minutes before the trading session closes, right? So I also consider the current day's candle in my analysis
[01:57] . So I need to ask myself the following: do I have two candles closing below the moving average of five lows? If the answer is yes, then I have the have the purchase condition being met. Look, when you look
[02:14] at the closing price of this candle, even though there are still 10 minutes left until the market closes, you can see that it was closing below the moving average of 5 lows, okay? So, in this case , this candle counts as a
[02:28] candle that is closing below the moving average of five lows. In order for me to be allowed to enter a buy position close to the market close, I market close, I need at least two candles that
[02:43] are closing below the moving average of 5 lows. And then you look back here, and you realize that this candle here also closed below the moving average of 5 lows. Once I've done the analysis and realized that I
[02:56] have two candles closing below the lower line, then I can enter a buy position close to the market close. I entered the purchase here. What am I going to do? So I'm going to set a target of 1%,
[03:11] set a target of 1%, an emergency stop of 8%, and I'll have an exit signal based on that upper line of our envelope. Right? The
[03:23] upper line of our envelope. Right? The stop is an emergency stop. Why? In this case, I'm going to place this stop not so that it will be triggered, right? No, I don't want that stop to be hit too many times.
[03:37] It's just an emergency stop-loss in case the market enters a I set it at 8% to keep it away from the price, because I'll have another way to exit the trade besides the stop loss, right? I have the target and I
[03:53] also have an exit signal. The output signal is as follows. If I entered a trade and the market failed to hit the target, and the market failed to hit the target, didn't trigger the stop loss, and closed
[04:07] above the upper line of my envelope, which in this case is the moving average of five highs, then I close the trade, right? So I have another way to exit besides the target and the stop loss. Right? That's why
[04:22] I placed that stop further away. I'm not necessarily going to always end up with an 8% loss; I could end up with a smaller loss. But in this case, as soon as I enter the trade, I have a target of 1% and a stop loss of 8%.
[04:36] And this is what's going to happen here. Most of the time the target will be hit. This strategy has a 90% success rate on the daily chart, right? 90% accuracy. Then
[04:48] daily chart, right? 90% accuracy. Then we wait again for a new purchasing pattern to emerge. And in this case, I had an entry point occurring. Look here, that's why I made this entry . This candle closed below the lower line,
[05:01] . This candle closed below the lower line, the lower line. With 10 minutes left before the trading session closes, I enter a before the trading session closes, I enter a buy position. Target of 1%, stop at 8%, and that's the
[05:13] exit signal, right? It was also used in the strategy there, and the target was hit, as happens most of the time. Let's watch it again, okay here, look. Why did I make this entry?
[05:29] A candle closed below the lower line of our moving average envelope. And then another candle also closed below the lower line of our moving average envelope, like it did here. One, two. Okay, with 10 minutes left
[05:45] until the trading session closes. I confirmed that this candle closed below the lower line. I'm going to enter a buy position with a target of 1%, a stop loss of 8%, a swing trade, right? target of 1%, a stop loss of 8%, a swing trade, right? Swing trade, there you go, 1% target reached,
[06:00] right? And look, it's closed here, okay? We had this closure below the bottom line. Right after that, this candle here also closed below the lower line, giving us a
[06:14] sequence of two candles closing below the moving average of five lows, right? So we enter the buying position near the end we enter the buying position near the end of the trading session with a target of 1% and a stop loss of 8%.
[06:28] of the trading session with a target of 1% and a stop loss of 8%. Let's take a look here. Target hit. Let's look at it again. Another entry made here, look. Two candles closing below the bottom line.
[06:40] Two candles closing lower. The analysis is done at the end of the day, right? So, he confirmed that. We enter the buy position at the end of the day with a target of 1%, and a stop loss of at the end of the day with a target of 1%, and a stop loss of 8%. The target was hit once again.
[06:54] Let's look at another entry here. Two candles another entry here. Two candles closing below the bottom line. closing below the bottom line. Confirmation at the end of the day. It's confirmed
[07:06] that both candles are closing below the lower line, right? So we're going to get into the lower line, right? So we're going to get into the purchase. With 10 minutes to go, the target was hit. Target of 1%, stop at 8%. Here's another entry again
[07:20] . Why? Because he considered that previous candle, and that previous candle also closed below the lower line, okay? It also closed below the bottom line, and this current candle here, it was also closing below the
[07:33] bottom line. So he entered a buy position with a target of 1% and a stop loss of 8%. We have an extremely upward-sloping capital curve here .
[07:51] SG3 daily chart we had 286 trades with a profit factor of 2.87, a profit factor of 2.87, a 92% success rate, a payoff of 0.22, and a drawdown of 7.79%. Always remember that I'm using
[08:06] the exit signal here. Look, we entered here, entered here, placed the 8% stop, and further down you can see that the market was falling, it didn't hit the target, but it also didn't hit
[08:18] the stop and closed above the upper line. Then I make the output using the output signal. Look, this hundred here closed above the top line. So I made the exit here, managing to leave with a smaller loss. In this case, the
[08:32] loss was 1.99%. See? So, I'm not always going to end up with a See? So, I'm not always going to end up with a loss greater than 8%, like I did here . Okay? I won't always end up with a loss of more than 8%.
[08:47] I often manage to exit with a smaller loss by using this exit signal. If I set a target of, for example, 2%, it will also work, see? Look, a target of 2% also becomes interesting. But the success rate
[09:01] drops, right? In this case, I have an 82% success rate. If I use the 2% target, right? And so here I am with a profit factor of 2.20. This is using a 2% target. If I set a target of 3%, for example, let's
[09:18] see what the capital curve looks like. A 3% target works too, right? But the case, if we want a very high success rate, the ideal target is 1%, right? I'll put it here, see, target of 1%. This strategy will
[09:33] work not only on the EG3 daily chart, but also on others, such as the EQTL3 daily chart. Profit factors daily chart. Profit factors of 2.58, 232 trades, 90% success rate,
[09:46] payoff of 0.27. We had a 10% discount here. These were the operations, as you can see, right? The operations here, you can see, right? The operations here, in this case, in EQTL3, look at these
[10:00] sequences here, right? Logically, with this setup here, when the stop-loss is triggered, if the 8% stop-loss is hit, it's going to be a big loss, right? But you can see that he handled it well in the capital curve.
[10:21] And it will also work on Vivit 3, Vivit 3 daily chart. Here it is. Vivit 3 daily chart. Here it is. In Vivit 3, we had 273 trades, a profit factor of 2.83, an 89% success rate, a payoff of 0.34,
[10:36] resulting in a drodal of 9.29 and an excellent capital curve.
[10:51] ITSA3 (daily chart). We had 319 trades here with an 88% success rate, a 319 trades here with an 88% success rate, a profit factor of 2.11, a payoff of 0.24, and a profit factor of 2.11, a payoff of 0.24, and a return of 16% with this capital curve.
[11:10] for the daily chart. Several actions will work very well; just run tests and look for the best ones. A very interesting strategy, using the average of five highs and the average of five lows. If you enjoyed this
[11:23] see you in the next one. Receive the channel's various strategies. There are dozens of open-source codes that you can use freely in your profit chart. Enroll today and receive, in addition to various setups,
[11:38] complete training teaching you step-by-step how to create strategies in the Profit Chart editor. And best of all, when you enroll, you get access to we share various codes and create several strategies based on
[11:53] your feedback. Do you need to program a setup and don't know how? Through our support service, we create the code for you. Enroll today and get access to all of this right away . We share the setups with
[12:07] 100% open source code. You can request as many codes as you like throughout the two months of support. You will learn from scratch how to set up various trading systems and obtain statistics to discover
[12:21] winning strategies. A training program designed to teach traders to be more than just ordinary investors; they should develop new strategies develop new strategies for the stock market.


⚡ Saved you 0h 12m reading this? Transcribe any YouTube video for free — no signup needed.