
Why You Keep Getting Liquidated
42sReveals the market makers' secret algorithm to hunt stop losses, creating a relatable 'aha' moment for traders who've lost money.
▶ Play Clip"The title accurately promises a breakdown of six ICT concepts, and the video delivers exactly that with clear definitions and examples."
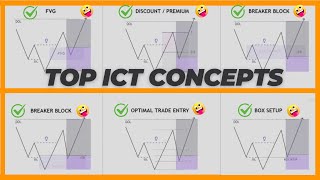
This video breaks down six core ICT (Inner Circle Trader) concepts essential for smart money trading: liquidity, displacement, fair value gaps, order blocks, breaker blocks, and market structure shifts. It explains how institutional traders manipulate price to hunt retail stop losses and provides step-by-step guidance on identifying high-probability trade setups using these concepts.
Market makers use algorithms to hunt stop losses, generating liquidity. Buy-side liquidity accumulates above highs; sell-side liquidity below lows. Sweeping these levels allows institutions to reverse price.
Displacement is a strong price move with at least three consecutive candles (large bodies, small wicks) and a fair value gap. Bullish displacement follows a sell-side sweep; bearish displacement follows a buy-side sweep.
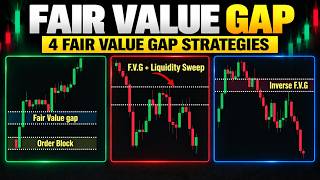
An FVG forms between the wicks of three candles where the middle candle's body is not overlapped. In bullish trends, FVG acts as support; in bearish trends, as resistance. Price often retraces to fill the gap before continuing.
Valid order blocks require inefficiency (sharp move), liquidity collection, and a break in market structure. Bullish order blocks form at the origin of a bullish reversal; bearish order blocks at the origin of a bearish reversal.
When an order block fails after a liquidity sweep and structure shift, it becomes a breaker block. Bullish breaker block: price closes above a bearish order block. Bearish breaker block: price closes below a bullish order block.
An MSS occurs when price breaks a previous lower high (bullish) or higher low (bearish) with displacement. It signals a trend change. Trade entries use retests of order blocks or breaker blocks with a 1:2 risk-reward ratio.
Mastering these six ICT concepts—liquidity, displacement, fair value gaps, order blocks, breaker blocks, and market structure shifts—enables traders to align with institutional order flow and improve trade accuracy. Combining them with proper risk management (stop loss 10-20 pips beyond key zones) and a 1:2 risk-reward ratio can significantly boost trading performance.
What are the two main types of liquidity in ICT trading?
Buy-side liquidity and sell-side liquidity.
01:12
How is a bullish displacement move identified?
At least three consecutive bullish candlesticks with large bodies and small wicks, often with a fair value gap between them.
04:52
What is a fair value gap (FVG) in ICT?
A gap between the wick of the first candle and the wick of the third candle in a three-candle formation where the middle candle's body is not overlapped, indicating a price imbalance.
09:43
What three criteria define a valid order block?
Inefficiency (sharp price move), liquidity collection, and a break in market structure.
14:16
What is a bullish breaker block?
A failed bearish order block where price closes above its high after a liquidity sweep and market structure shift, turning it into support.
20:23
What signals a bullish market structure shift?
Price breaks a previous lower high with a displacement move, transitioning from a bearish to a bullish trend.
25:08
Where should a stop loss be placed for a bullish breaker block trade?
10 to 20 pips below the low of the breaker block.
22:50
What is the recommended risk-reward ratio for market structure shift trades?
1:2 risk-reward ratio.
26:55
Liquidity as Primary Price Driver
Establishes the foundational concept that price moves to collect liquidity, not random noise.
00:30Displacement Reveals Institutional Orders
Provides a clear visual pattern to detect when smart money is actively entering the market.
04:23Fair Value Gap as Imbalance Zone
Offers a precise entry/exit zone based on price inefficiency, applicable across all markets.
09:31Order Blocks: Institutional Entry Zones
Differentiates order blocks from ordinary support/resistance by requiring a market structure break.
13:17Breaker Blocks: Failed Order Blocks
Explains how to adapt when an order block fails, turning a loss into a new opportunity.
19:42Market Structure Shift for Trend Reversal
Provides a systematic method to identify trend changes early and align with institutional flow.
24:14[00:03] Concepts that have been game changers for consistent successful trading today we'll break down the definitions core principles and how to apply these catch high probability trades if that sounds like something
[00:18] you're excited about make sure to hit that like button and if you're new here don't forget to subscribe to stay updated with all our latest strategies let's start with the first concept liquidity
[00:30] as a Trader if you don't understand liquidity in the market you might become the liquidity market makers use algorithms to hunt liquidity and they in the market when you buy at a support level
[00:44] below that level to protect your position market makers are fully aware of this and their systems are designed to hunt these stop losses to generate liquidity in the market similarly when you sell at a resistance level the
[00:58] resistance hit your stop loss and then move in the direction you originally anticipated why does this happen because the market is driven by liquidity liquidity is the primary cause of price
[01:12] movement there are two main types of liquidity buy side liquidity and sell-side liquidity buy side liquidity according to Inner Circle Trader buy side liquidity refers to the volume of
[01:24] pending buy orders also known as buy stops when Traders Place sell orders protection in case the market moves against their trade these buy stops are typically positioned above price levels like previous highs weekly highs or
[01:39] daily highs these levels are considered buy side liquidity and market makers Target these highs to convert pending orders into Market orders allowing them to push the market in the opposite direction as shown in the example equal
[01:53] Highs are considered buy side liquidity market makers sweep these old highs clear the buy side liquidity and then drive the market down which is a perfect example of a buy side liquidity hunt now sell-side liquidity as defined
[02:07] by ICT refers to the accumulation of pending sell orders especially sell stop orders when Traders place by orders they use sell stops as protection in case the price drops sell stops are placed below key price levels like historical lows
[02:22] including weekly and daily lows these areas are considered sell-side liquidity as they hold concentrated sell orders Market makers aim to exploit this by pushing the market to these lows triggering the sell stops and converting
[02:35] them into Market orders once this liquidity is grabbed market makers often from retail Traders as you can see in this chart example the market was in an uptrend with buyers in control when the market
[02:50] approached this resistance level many Traders expected a reversal they entered short positions and placed their stop losses just above the resistance at the same same time breakout Traders anticipated a continuation of the upward
[03:03] movement placing their byy entries above the resistance and stop losses below the level however the market makers exploited both groups the price broke above resistance triggering the stop losses of the short Traders then
[03:18] reversed taking out the stop losses of the breakout Traders position below the level this manipulation where the market sweeps liquidity from both sides before moving in the opposite direction is known as a buy side liquidity
[03:31] hunt as seen in this chart example the market was trending downward with control as the price reached a key support level many Traders anticipated a bounce and entered long positions placing their stop losses just below the
[03:45] support at the same time some breakout Traders were expecting the market to break through the support and continue lower placing their cell entries below positioned above it the market makers saw this liquidity
[03:58] on both sides the price initially broke below the support triggering the stop losses of the long Traders and activating the sell orders from the breakout Traders but instead of continuing lower
[04:10] the market reversed direction moving back up and hitting the stop losses of Traders this is an example of a sell-side liquidity hunt where the market sweeps liquidity below a support level before reversing sharply to the
[04:23] upside next on the list displacement a key ICT concept displacement refers to mve moving something from one place to another in ICT trading displacement move caused by large institutional orders these moves indicate that smart
[04:39] money is actively participating in the market displacement helps Traders identify the direction of these large orders a bullish displacement move is a strong upward price movement showing that smart money is buying into the
[04:52] market to recognize a bullish displacement move look for at least three bullish candlesticks in a row these candles scks should have large bodies and very small Wicks or no Wicks at all the price movement should be
[05:05] smooth with no major retracements a fair value Gap or fvg between the candlesticks confirms displacement the Gap indicates that the market has moved quickly leaving an area of inefficiency caused by smart
[05:19] money this type of move shows that institutions are pushing the market higher with force a bearish displacement move is a strong downward price movement indicating that smart is selling heavily to recognize a bearish displacement move
[05:33] look for at least three bearish candlesticks in a row these candlesticks should have large bodies and little to no Wicks the price should drop with strong momentum and limited retracements a fair value Gap or fvg between the
[05:47] candlesticks confirms the displacement this Gap shows that the market has dropped quickly due to large institutional selling this type of move shows that institutions are driving the market down
[05:59] examples to help you understand how to identify bullish and bearish displacement in action first we'll look at a bullish displacement example which occurs after a sell-side liquidity sweep in this
[06:13] and approached a significant support level many Traders expected the market to break through this support and continue lower as a result they placed short orders while Traders going long position their stop losses just below
[06:27] the support what happened next the market briefly broke below the support level triggering the stop losses of long Traders and activating the sell orders of breakout Traders expecting a continuation
[06:40] liquidity that was resting below the support level however instead of continuing lower the market quickly reversed to the upside this sharp reversal is what we call a bullish displacement to identify
[06:54] it look for at least three consecutive bullish candlesticks with strong bodies which signals strong buying momentum while minimal Wicks are recommended what matters most is the aggressive price move with minimal
[07:08] retracement in addition you may notice a fair value Gap forming between the bullish candles this Gap represents a price imbalance created by smart money entering the market the fair value Gap
[07:20] institutional players were involved in the displacement this bullish displacement shows how smart money used the cell-side liquidity sweep to drive D the market higher trapping retail traders who were
[07:32] liquidity grab now let's look at a bearish displacement example which happens after a buy side liquidity sweep in this case the market was trending upward and reached a key resistance level many
[07:47] Traders expected the market to break through the resistance and continue higher While others entered short positions placing their stop losses above the resistance level the market briefly broke above the resistance
[07:59] Traders and activating the by orders of those who anticipated a breakout this move swept the buy side liquidity resting above the resistance level however instead of continuing upward the market quickly reversed
[08:14] closing back below the resistance level and moving downward aggressively this reversal marks a bearish displacement to spot this bearish displacement look for at least three consecutive bearish candlesticks with strong bodies showing
[08:27] clear momentum to the downside again minimal Wicks are recommended but not a requirement the key is the strong unbroken move down with little retracement as with the bullish example
[08:39] a fair value Gap may form between the bearish candles further confirming the displacement and highlighting the presence of smart money this bearish displacement illustrates how the market makers swept by side liquidity above the
[08:52] resistance trapping retail traders who were long before driving the price lower in the opposite direction why is displacement important displacement is crucial because it reveals when smart money is
[09:05] actively entering the market with large orders these strong price moves signal the direction of institutional flow understanding displacement is key as we combine it with other ICT Concepts such as order blocks breaker blocks and
[09:19] probability trade setups and don't worry we'll cover all exactly how to use them together to pinpoint those High probability setups
[09:31] clear understanding of how to leverage these powerful tools like a professional up next fair value Gap another crucial ICT concept an ICT fair
[09:43] value Gap also referred to as an imbalance or inefficiency is a crucial Concept in smart money trading it can be applied across various markets including Forex stocks crypto and commodities the ICT fair value Gap is
[09:57] identified in a three candle formation the middle candle is generally larger with a wider body representing significant price momentum the first and third candles are shorter and don't overlap the body of the middle candle
[10:10] this creates a clear gap between the wick of the first candle and the wick of the third candle referred to as the fair value Gap this Gap highlights where the market moved too fast for balance price action to occur signaling institutional
[10:23] involvement the gap between these Wicks where price hasn't been fully traded is the area of in efficiency or imbalance to trade effectively using the fair value Gap we must first determine the Market's Trend as bullish and
[10:37] bearish fair value gaps behave differently a bullish fair value Gap forms in a bullish Market the middle candle is a strong bullish candle with a large body and a gap exists between the high of the first candle and the low of
[10:51] the third candle in a bullish Trend the fair value Gap often acts as support with price tending to fill this gap before continuing upward movement a bearish fair value Gap occurs in a bearish market in this case the middle
[11:05] candle is a large bearish candle with a wide body and a gap forms between the low of the first candle and the high of the third candle in a bearish trend the fair value Gap typically acts as resistance with price often retracing to
[11:19] resistance with price often retracing to fill the gap before continuing downward steps to trade using ICT fair value gaps the first step is identifying the overall Market Trend bullish or bearish in a bullish Trend the market makes
[11:32] higher highs and higher lows while in a bearish trend the market forms lower highs and lower lows once the trend is identified the next task is to locate a large candle with a wide body and small wicks in a bullish Trend look for a
[11:47] strong bullish candle and in a bearish trend search for a large bearish candle after identifying a large candle examine the proceeding and following examine the proceeding and following candles for a valid fair value Gap the
[12:01] bodies of these two candles should not overlap the body of the middle candle first and third candles in a bullish Trend the gap the low of the third candle is your fair value Gap in a bearish trend the fair
[12:18] the first candle and the high of the third candle to increase the probability of success ensure that the identified fair value Gap aligns with significant levels such as a previous resistance turned support in a bullish Trend or
[12:33] support turned resistance in a bearish trend if the market is trending bullish wait for the price to retrace and test the fair value Gap when the price retraces and touches this Gap look for additional confirmation such as a market
[12:47] structure shift or rejection on a lower time frame before entering a Buy trade on higher time frames such as the daily you can execute trades on the same time frame as you can see here after the formation of a pin bar that was rejected
[13:02] from the fair value Gap the market moved up again in a bearish trend wait for the price to retrace upward and test the fair value Gap once the Gap is tested look for technical confirmation like a rejection or structure shift to initiate
[13:16] a sell trade now let's move to the next important concept order blocks order blocks are key zones in the market where placed by institutions also known as smart money these levels
[13:32] represent significant supply and demand areas that have already been rejected by the market making them highly relevant for future price action when price strong chance the market will react similarly offering potential trading
[13:47] opportunities however while every Supply or demand Zone shows where price has reacted not all supply and demand areas qualify as order essential for improving your trading strategy and avoiding common
[14:00] pitfalls so what defines a valid order block when large Traders or institutions take major positions they leave footprints in the form of price movement they reveal where smart money has entered the market but to be classified
[14:16] as a valid order block the area must meet certain criteria making it more reliable for future trades here are the Key conditions that Define a valid order block inefficiency for an order block to be
[14:28] valid it should reflect an inefficient price move where the market has moved sharply in One Direction leaving behind a clear imbalance in price this often happens because large institutional orders move the market
[14:40] quickly creating gaps or unfilled areas in the price action this imbalance is an involved and the market will likely return to that area to rebalance the price liquidity collection a key feature of order blocks
[14:55] is their ability to collect liquidity this happens when the market Market manipulates price triggering stop losses or pending orders placed by Traders smart money often uses these liquidity grabs to fuel their positions
[15:08] before moving price in the opposite direction in a bullish scenario liquidity is collected below support levels while in a bearish scenario liquidity is collected above resistance once this liquidity is swept
[15:21] intended Direction and the origin of this move is what we identify as the block the final and perhaps most important Criterion for a valid order block is that it must cause a break in Market structure this is what
[15:35] differentiates a regular Supply or demand Zone from an order Block in a bullish Market when price breaks above a significant previous High the point where the price originated from becomes an influential demand area known as a
[15:48] bullish order block conversely in a bearish market when price breaks below a key low the area of Supply that caused the breakdown becomes a bearish order block this structural break confirms that smart money has participated in the
[16:01] move reinforcing the significance of the order block for future price action let's dive into a real chart example to help you understand how a can use it in your trading in this example the market had
[16:15] been trending downward creating lower highs and lower lows indicating a trend however as the price approached a key support level we notice a sharp price reversal this reversal creates the foundation of our bullish quarter
[16:29] block here's how to break it down step by step identify the market structure break as the market reached a significant low It reversed sharply creating a higher high and breaking the previous lower
[16:42] structure this break in Market structure is critical because it indicates that smart money has stepped in Shifting the trend from bearish to bullish find the origin of the move after the market structure is
[16:55] broken look to the origin of the bullish move this this area represents the order block where smart money accumulated long positions in this case it is a strong bullish candle near the bottom of the downtrend right before the reversal
[17:09] check for Price imbalance a clear fair value Gap or Price imbalance is Left Behind after the strong upward move this Gap further confirms that institutional aggressively leaving unfilled orders that the market May return to fill watch
[17:25] after the initial bullish push the Market pulls back and returns to the order block this is where we wait for confirmation of a potential long trade the price enters the order block testing the demand Zone where smart money had
[17:39] entered look for confirmation and execute the trade as the price revisits the order block we look for confirmation signals such as rejection Wicks a structure shift or bullish Candlestick patterns these signals indicate that the
[17:53] order block is holding a support once the price begins to move enter a bu trade in alignment with the bullish momentum now let's go over a bearish order block example which works
[18:06] similarly but in the opposite direction in this chart the market was trending upward forming higher highs and higher lows but as the price reached a significant resistance level the market failed to continue upward creating a
[18:19] sharp reversal and breaking the previous higher low structure this break-in structure signals the beginning of a bearish trend step one ident identify the market structure break after the price fails to make a
[18:33] new high it reverses and breaks the most recent higher low confirming that the market structure has shifted from bullish to bearish step two find the origin of the move the origin of this strong downward movement is the order
[18:45] block where smart money likely entered short positions this area is often represented by a large bearish candle right before the sharp move downward step three check for Price imbalance a fair value Gap or Price
[19:00] inefficiency forms as the price drops quickly signaling that the market May return to this Zone before continuing lower step four watch the price return to the order block after the initial downward move the market retraces upward
[19:14] and revisits the order block here you can wait for the price to test the supply Zone created by smart money shorts step five look for confirmation and execute the trade as the price re-enters the bearish order block look
[19:28] patterns to confirm the resistance is holding once you see these signals you can enter a sell trade anticipating further downside movement as the bearish trend resumes next up break a block a key
[19:42] smart money concept a breaker block occurs when a previous order block fails after a liquidity sweep or a market structure shift even though smart money concepts are highly effective no strategy is foolproof Traders using
[19:55] smart money Concepts may buy at bullish order blocks and place their stop loss sell at bearish order blocks with their stop loss above the high however market makers often take advantage of these positions hunting stop losses and moving
[20:10] breaking the order block which transforms it into what we call a breaker block just like order blocks breaker blocks come in two types bullish breaker Block bearish Breaker block a bullish
[20:23] breaker block occurs when a bearish order block fails according to ICT all closed candles before a swing high that sweeps liquidity and then gets broken can be considered part of the breaker block however the last up Clos candle is
[20:37] often the most significant in simpler terms a bullish breaker block is a failed bearish order block when the price closes above the high of the bearish order block after sweeping liquidity and shifting Market
[20:50] structure the previously bearish block becomes support and we refer to it as a bullish breaker block to identify a valid bull bullish breaker block look for the following conditions a valid bearish order block
[21:03] the price closes above the high of the bearish order block a liquidity sweep has occurred there is a market structure shift a bearish breaker block is the opposite it's a failed bullish order block when the price closes below the
[21:18] previously bullish order block becomes resistance and is now known as a bearish breaker block to confirm a valid bearish breaker block you should check for the following a valid bullish order block the price closes below the low of the
[21:32] bullish order block a liquidity sweep has occurred there is a market structure shift now let's dive into the bullish breaker block trading strategy we
[21:44] generally prefer to trade with the trend because as they say the trend is your friend therefore we look for bullish breaker blocks in a bullish Trend here's the process in a bullish Trend when the market creates a bearish order block
[21:58] sellers are often drawn in instead of the price continuing lower the market sweeps the stop losses of these sellers and breaks above the bearish order block once the price closes above the high of the bearish order block sweeping
[22:11] liquidity and Shifting the market structure the broken bearish order block becomes a bullish breaker block we then wait for the price to retrace to the bullish breaker block when the market test this area it's an opportunity to
[22:24] execute a Buy trade look for further confirmation on structure shift or rejection from the bullish breaker block Zone if you're trading on the daily chart as in the example provided there is no need to
[22:38] look for further confirmation on Lower time frames or conduct a top- down analysis the daily chart inherently offers higher probability setups due to its strength and reliability in capturing broader Market
[22:50] movements when executing a trade using the bullish breaker Block it's advisable to place your stop loss 10 to 20 Pips below the low of the breaker block to retests lower levels next let's explore the bearish
[23:04] breaker block trading strategy similarly in a bearish trend we use the bearish breaker block for sell trades here's how it works in a bearish trend the market in buyers however instead of continuing
[23:20] of the buyers and breaks below the bullish order block when the price order block block indicating a liquidity sweep and a shift in Market structure
[23:32] the broken bullish order block turns into a bearish breaker block we wait for the price to retrace back to this bearish breaker block and when it does sell trade as always you should seek further
[23:46] confirmation such as a market structure shift or Price rejection in lower time frames before executing the trade if you're trading on the daily chart as in the example provided there is no need to look for further confirmation on Lower
[23:59] time frames or conduct a top- down analysis the daily chart inherently its strength and reliability in capturing broader Market movements for bearish breaker block trades place your stoploss 10 to 20 Pips
[24:14] protect yourself from any further price movement in the opposite movement in the opposite direction now let's move to the next ICT concept Market structure shift a market structure shift occurs when there is a
[24:28] clear change in the Market's directional Trend in a typical Market environment prices follow Trends moving either upward or downward creating higher highs and higher lows in an uptrend or lower highs and lower lows in a downtrend when
[24:41] this pattern breaks and the market changes Direction it's referred to as a market structure shift Market structure shifts are vital to understanding how smart money operates as they often Mark the point
[24:53] where large institutions are reversing the trend to trap retail Traders and move the Market in their favor recognizing these shifts early can help institutional order flow a bullish Market structure shift
[25:08] occurs when the market transitions from a bearish to a bullish Trend in a bearish market the price creates lower highs and lower lows as it moves downward a bullish Market structure shift happens when the market moves
[25:20] upward with displacement and breaks a previous lower high this lower high is significant because it has already taken out a previous low low and breaking it signals that the bearish trend is over in simple terms a bullish Market
[25:34] structure shift is when price starts to break through important resistance levels in a downward Trend indicating that the market is now shifting upward a bearish market structure shift occurs when the market transitions from
[25:47] a bullish to a bearish trend in a bullish Market the price forms higher highs and higher lows as it moves upward a bearish market structure shift occurs when price moves downward with displ and breaks a significant higher low this
[26:01] higher low is important because it has already taken out a previous high and breaking it signals that the bullish trend is likely ending in summary a bearish market structure shift is when price breaks through important support
[26:14] levels in an upward Trend signaling that the market is Shifting downward next let's cover how to trade a bullish Market structure shift when the market shifts from bearish to bullish the objective is to catch the reversal
[26:27] while using displacement fair value gaps and Order blocks to optimize trade entries here's the step-by-step process to trade a bullish Market structure shift identify the shift once you see the market break the previous lower high
[26:42] with a displacement move the market structure has shifted bullish wait for a retest when the market pulls back and retests the order block look for confirmation that the market is respecting these levels execute a by
[26:55] trade once you have confirmation execute a by trade your stop loss should be placed 10 to 20 Pips below the order block Zone and for your profit Target aim for a 1 to2 risk reward ratio in a bearish market structure
[27:10] shift the market is transitioning from bullish to bearish and the goal is to capitalize on the downward Trend using similar Concepts here's the step-by-step process to trade a bearish market structure shift identify the shift when
[27:24] the market breaks the previous higher low with a displacement move this confirms that the market structure has shifted to bearish Mark the key areas identify any relevant fair value gaps order blocks or breaker blocks these
[27:38] to retest before continuing the bearish trend in this case a breaker block has potential zone for the market to retest before continuing the bearish trend this
[27:50] further confirms the likelihood of the Market's continuation in the bearish direction wait for a retest allow the market to reach Trace upward and test rejection or confirmation that these areas are acting as resistance execute a
[28:05] sell trade once confirmed you can execute a sell trade your stop loss should be placed 10 to 20 Pips above the breaker block for profit targets aim for a 1 to2 risk reward ratio that's it for today's breakdown of
[28:20] the top ICT Concepts I hope this video gave you valuable insights to boost your trading game if you enjoyed this make sure to to hit the like button subscribe for more in-depth trading strategies and turn on the notification Bell so you
[28:33] never miss an update drop a comment below with your thoughts or questions I'd love to hear from you thanks for watching and I'll see you in the next watching and I'll see you in the next video
⚡ Saved you 0h 28m reading this? Transcribe any YouTube video for free — no signup needed.