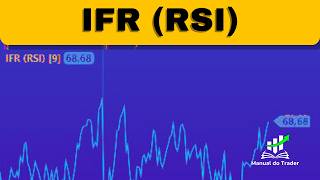

The RSI Indicator: Your Secret Weapon
45sQuick, engaging intro that promises to reveal the secrets of a popular trading indicator, hooking viewers interested in trading.
▶ Play Clip"The title promises a real trading secret but it's a solid yet basic RSI overview with platform demo — valuable but not truly 'big', though not overtly overblown."
This video provides a comprehensive tutorial on the Relative Strength Index (RSI), a widely used momentum indicator in technical analysis. The hosts explain its core concepts, practical application on the Profit platform, and alternative settings to improve its effectiveness.
The RSI is one of the most widely used indicators in the world, essential for understanding buying and selling opportunities.
Created by John Wells Wilder in 1978, the RSI is a momentum indicator that measures the speed and intensity of price movements, ranging from 0 to 100, to identify overbought and oversold conditions.
Overbought teri is an extreme price situation suggesting a possible reversal. It happens when a rapid price increase surpasses the fair market value, while oversold is the opposite.
Values above 70 indicate overbought conditions, suggesting the asset is expensive and likely to correct soon; values below 30 indicate oversold, suggesting the asset is cheap and likely to recover.
The RSI is only a supplement: it should be used in conjunction with other indicators or strategies that confirm exit and reduce risks, prioritizing safety.
Demonstration of adding the RSI indicator on the Profit platform: right-click, indicators, select RSI, and adjust properties.
The classic default period is 14, but users can experiment with other values to see what works best for them.
Using Price Scale Properties, add horizontal grid lines at levels 30 and 70 to visually identify overbought/oversold zones on the RSI chart.
A example shows that when the RSI returns below 70 (e.g., from 69 to 68), a trader might enter a sell position, with stop loss usually at the top, and take profit 1:1 (e.g., 270 points).
Stop-loss is placed at recent highs, and take-profit can be set to 1:1 risk:reward.
A second example shows that a signal can fail, where price hits stop-loss before reaching target, when the RSI and range was not trigger yet reverse, or when RRSI is used alone can generate false trades.
Recommendation for US settings: use 80/20 levels instead of 70/30. The RSI signal that it is more overbough t overwrought, can be more reliable. Demonstrate the setup.
A successful trade example using new RSI settings, showing entry here, stop at high, profit target 112 points, and a subsequent success.
The period can be adjusted. For stocks, 14 might be better, but for mini index 9 works better for a faster timeframe. Daily, weekly, and 5-minute chart100% periods depending on.
Key tips: adjust the RSI period to asset and timeframe; combine RSI with other indicators to avoid false positives; understand that during strong trends RSI can stay in extreme zones; manage risk, follow the plan, and avoid."
The RSI is that powerful for
The RSI is a powerful tool. It should be combined with other indicators and effective developed to be part of one's trading arsenal.
Who created and in what year, │ the Relative Strength Index (RSI)?
JohnR.Wilder, 1978.
00:36
What does the RRSI measure, RRSI M4 M
The speed of price movements, price momentum
00:134
What are the standard RRS overbought and oversold levels on RRSI?
Overbought = above 70, oversold = below 30.
01:07
What does a 80/20 setup do compared to RRS/RRM
It ts a threshold, extreme, more oversold values.
07:57
What is a standard RRSI period in RRS RSI. It is
Standard period is 14.
08:51
When can RRS stay above 70 for longer periods?
During strongly trending
11:09
The Origin and Definition of RSI
Sets the foundation of RSI for RSI,
00:52Practical RSI lifecycle
By live demo helps itself instantly operational implementation on the trading platform.
02:37Why 80/20 its
Strong practical tip for RRI strength traders, standard threshold or low risk
07:57Key trading tips
Important risk management and RRR management generality is critical for any trader,
10:38RSG., RRSI in Conjunction Signals
Emphasizes that RS not alone, prevents false signals
10:52[00:03] open your manual. I am Lis and I am Ricardo. And today we're going to explore the RSI, or Relative Strength Index . It's one of the most widely
[00:15] used indicators in the world, and we're going to explain everything about it today, right? The RSI (Relative Strength Index) is essential for you to better understand buying and selling opportunities. And in today's video we're going to show you the main aspects of this
[00:31] indicator, as well as some very important tips to help you learn how to use it most effectively. That's right. So go ahead, like the video, subscribe to our channel, and let's get to the video.
[00:52] The RSI, or IFR, was created by John Wells Wier Jor in 1978 and is a momentum indicator that measures the speed and intensity of price movements. It will range from 0 to 100 and helps to identify overbought
[01:08] and oversold conditions. Furthermore, the RSI will allow you to observe trends and divergences between the price and the indicator that may signal changes in market direction. But what exactly is overbought or oversold? For those of you
[01:23] who may not be very familiar, overbought and oversold is a concept in technical analysis that indicates an extreme price of an asset, suggesting a possible reversal. When, for example, we have
[01:38] reversal. When, for example, we have a very rapid price increase that surpasses an intrinsic value, or a value that you consider fair, or that the market considers fair, we will have an overbuying situation. When the opposite happens,
[01:50] overbuying situation. When the opposite happens, an abrupt drop in price and it falls fair market value, it is an oversold condition. So how are we going to interpret the RSI? Values above 70 indicate overbought conditions, suggesting that the asset
[02:07] is expensive and will likely correct soon. Values below 30 indicate overselling, suggesting that the asset is cheap and a recovery is certain. It's important to remember that the RSI or RSI is only a
[02:23] momentum indicator. It should be used in conjunction with other indicators or in strategies that confirm the exit and reduce risks, thus prioritizing your safety. So now I'm going to show you in Profit
[02:37] So now I'm going to show you in Profit how to insert the RSI indicator, the RSI, and how to use it. OK? So let's open Profit and, to begin, right-click,
[02:51] to begin, right-click, indicators, let's go to RSI, RSI. And it's different from some indicators; it's not on the chart itself, it's below it. So we click here to insert a new window and it will appear
[03:06] down here. Let's double-click here on the left side to access its properties. Generally, the classic approach here would be around age 14. So it's up to you to try it out, see which one you adapt to
[03:20] best, which one you find most interesting, okay? So, applicable 14, I'll leave the orangey look as is . Well, what I like to do here on the right side is right-click and select "Price Scale Properties"
[03:34] . This little window will appear here. What this little window will do for us here in fixed grid, level 30 and explained, is that we can put a line to
[03:50] So, if we put, for example, white here, with a black background, I'm going to put a white line. Yeah, in the ' 70s, same thing, white here. Okay.
[04:02] 70s, same thing, white here. Okay. Did something happen? No. That's the thing. Let's go back there, right-click, properties, price scale, properties, price scale, fixed grid. What was missing here?
[04:14] Horizontal grid. Clicking here will show you both lines, exactly at level 70 and level 30. Let me zoom in a
[04:26] little to make it easier to see. So now we can perfectly observe when the RSI (Relative Strength Index) exceeds the 70 level, or conversely, when it falls below the 30 level,
[04:41] and these are the points we call overbought or oversold. So I'm going to pick a random day and go play it back here. Let's study. Okay, let's take this period here. Hmm. Here, look. There was a moment here of
[04:58] Here, look. There was a moment here of overcoming, of taking up the cross here. Look, the RSI has reached the overbought point here, which means that the asset may be overbought, with a price that is much higher than it should be.
[05:13] So now is the time to be alert in case a reversal is possible. It actually worked out well here. So when it returns, when the RSI returns below 70, which would be on this day here, in this candle here, that's when you
[05:29] enter, in this case selling. So what would we do? Let me put a line here. Or. This candle here was the candle that
[05:41] Or. This candle here was the candle that confirmed, right, the return to 69, 68, right, confirmed, right, the return to 69, 68, right, of the index. Well, and here in the next candle, we would make the sale. The stop loss is usually placed right at the top, isn't it?
[05:59] And the gain, well, that's up to you. You can do a one-on-one, right, that one- You can do a one-on-one, right, that one- on-one thing. So, if we have a stop loss of 270 points, we also take a profit of 270 points. It's
[06:14] super simple, right? So, we'll put 270 points here. When you reach the target, you close this transaction. And in this case, it worked out really well, right? It worked And in this case, it worked out really well, right? It worked perfectly, but it doesn't happen every time,
[06:29] right? Let's look at another example here. He came here, great, the price hit, it's already started, right, the day is already above, right, the 70 points when it went down, which in this case would be, more or less. Let's see what the price is here. He came down
[06:44] here. So, our sales entry point would be at this point here. So, our stop would be here. And what about our gain? We'll see. He would have had 230 points, but he didn't reach 230 points. It got here
[07:00] at around 200, 190 points, it didn't work out, it came back and hit our stop loss. So what could happen? Sometimes the 70 level is still a bit too
[07:12] low to actually cause a reversal. Or you could use only the IPR indicator; it 's not accurate enough to be used alone. Perhaps a moving average, maybe Bollinger Bands, or some other indicator that can help you
[07:28] enter trades, but without encountering these false trades that come up here. Then the price trades that come up here. Then the price shot up, and then, a little later on , when it shot up again, it came back down, and in that case, yes, you would have a sale, and then,
[07:42] further down the line, you managed to make a profit on the transaction. So there would be a loss at the beginning of the day and a game towards the end of the day, and maybe even a better game of 500 points, right? But what do I recommend, what do I usually do?
[07:57] Generally, when I use this type of indicator, I don't use 70/30, I use 80/20. Why? Because that means the level is actually more overbought or more oversold. So I change it here, I remove it
[08:13] So I change it here, I remove it here, right? So I include level 20 and I include level 80. I also make it white to make it easier to see. And if you want to leave both, you
[08:28] can too. Well, that's up to you. Or if you want to put a line here and indicate the position yourself on the line. Ah, I want it in position 70 here. Well, it's a line that you, you know, you work with, right? It 's not within the indicator itself, right? And here we
[08:45] can work with the most overbought and . He actually reached that point on this day . . Let's see.
[09:00] case, the sale would take place here, right? In this the sale would take place here, right? In this candle here. However, we also had a tiny little one . The sale would take place here. Actually, I think it went well.
[09:12] Let me check this out. Let's zoom in a bit more. Our loss would be Nels at this top spot here. And our game, let's go, 112 points. Look at that, it worked!
[09:25] 112 points, 112 points down. It would be more or less here. And then he was hit. So, in the same candle where we entered the same candle where we entered the sell position, we already entered with a profit here.
[09:39] Sometimes it doesn't work. Sure, you see, in theory it was a bit of luck because the next one already burst, broke, and went way up, but in this case it worked out, right? So it's a really cool indicator to use. It can be
[09:53] used in other ways; you can think a little more and do 14 isn't very good, go down a little to 12. Sometimes you can also use your timeframe for stocks and see that for stocks it's better to use 14, but for the
[10:09] mini-index it's better to use nine, which is a faster timeframe. So it depends a lot on whether you use the daily chart, weekly chart, 5-minute chart, as I 'm explaining here. So it depends a lot on the timeframe and the asset to
[10:22] know what the best position is, what the best period is, and whether it's what the best period is, and whether it's better to use 7030 or 8020. It will depend a lot on your testing. And some important tips are: adjust
[10:38] the RSI period according to the asset and the time frame. The standard timeframe used is usually 14, but it can be changed to shorter or longer periods depending on shorter or longer periods depending on your strategy. Combine the RSI with
[10:52] other indicators or analyses to avoid false positives and confirm signals. Pay close attention to avoid false positives. Also pay attention to market conditions. Well, in strong trends, the RSI can
[11:09] remain in overbought or oversold conditions for longer periods . Pay close attention to all of this and always use good all of this and always use good risk management and follow the planning, follow the
[11:23] strategy, follow your plan, okay? To avoid possible complications, right? Keep your mind focused on that specific area. That's it . In summary, then, the RSI, or Reliability-Standardized
[11:36] Indicator, is a very powerful tool for identifying overbought and oversold conditions, helping to anticipate possible market reversals. The RSI, combined with other indicators, is essential for an effective setup and should
[11:53] also be part of your arsenal, okay? And you, who loved this video, enjoyed this video, and made it this far, don't forget to like and comment forget to like and comment below, okay? Share this and tell
[12:07] us in the comments what topics you'd like to see covered here, and any other suggestions. But don't forget to check out our playlist with other indicators that we've already talked about here in the trader's manual, so you don't ask for
[12:21] something we've already mentioned, okay? Big hug, see you next time. Yeah.




⚡ Saved you 0h 12m reading this? Transcribe any YouTube video for free — no signup needed.