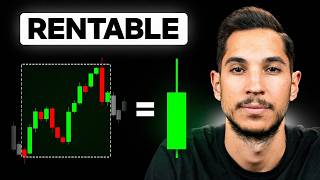

4 Steps to Profitable Trades
40sThe promise of a simple, proven method to break through trading plateaus hooks viewers seeking quick financial gains.
▶ Play Clip"The title promises a four-step method to find profitable trades, and the video delivers exactly that with clear explanations and examples."
The video outlines a four-step trading method based on Japanese candlesticks and price action, emphasizing fractality and trend reversals. The presenter claims this approach can help traders find profitable trades more frequently across any timeframe and asset.
The presenter explains that understanding the foundations behind trading can exponentially increase monthly profits, even for already profitable traders.
Support and resistance are key areas where price is likely to react. Resistance is where price fails to break upward; support is where price fails to break downward.
The market is fractal, meaning patterns repeat across different timeframes. This allows the same strategy to be applied to any timeframe, from scalping to swing trading.
To detect a trend reversal, identify a support or resistance on the daily timeframe, then drop to a lower timeframe (e.g., hourly) to see the trend change from higher highs/lows to lower highs/lows.
After detecting a trend reversal, wait for a pullback (a retracement) before entering. Look for deceleration and a bearish candle to confirm entry.
Enter at the pullback, place stop loss above the recent high, and take profit at a 3:1 risk-reward ratio. The method is a philosophy, not a rigid strategy.
Using fractals allows earlier entry, more trades, higher returns, and lower commissions compared to trading on higher timeframes without fractals.
The four-step method—identify key levels, detect trend reversals, wait for pullbacks, and manage risk with 3:1 reward—provides a consistent framework for profitable trading across all timeframes and assets.
What is a resistance level?
A point where the price tries to break upwards and can't.
01:23
What is fractality in trading?
The property that patterns repeat at different scales and timeframes, allowing the same strategy to be used on any timeframe.
02:56
How do you detect a trend reversal?
Identify a support or resistance on the daily timeframe, then drop to a lower timeframe and look for a change from higher highs/lows to lower highs/lows (or vice versa).
04:19
What should you do after detecting a trend reversal?
Wait for a pullback (retracement) and look for deceleration and a bearish/bullish candle to confirm entry.
08:35
What risk-reward ratio does the presenter recommend for take profit?
3:1.
10:21
Where should you place a stop loss for a short trade?
Above the recent high.
10:21
What is one advantage of using fractals to enter trades?
Earlier entry, more trades, higher returns, and lower commissions compared to trading on higher timeframes without fractals.
11:04
Fractality Explained
Introduces the core concept that patterns repeat across timeframes, enabling consistent strategy application.
02:56Trend Reversal Detection
Provides a practical method to spot trend changes using multiple timeframes.
04:19Pullback Entry
Emphasizes patience and confirmation before entering, a common mistake among beginners.
08:35Risk Management Rules
Clear stop loss and take profit guidelines (3:1 ratio) for consistent risk management.
10:21Fractal Advantage
Quantifies benefits of using fractals: earlier entries, more trades, higher returns.
11:04[00:02] really behind trading, the foundations that make up a winning strategy. Even though I was already profitable at that time, the monthly profit of my trading account increased exponentially. You might
[00:16] not be profitable yet, you might be just starting out, or you might even be close to your goal. So, I ask you to pay close attention to the following four steps, as I'm 100% sure they will help many of you
[00:29] break through your current situation. If you follow the method I'm about to explain in your daily trading, you'll start finding profitable trades more frequently. This trading method works on any
[00:42] timeframe and with any asset. It only takes into account Japanese candlesticks and price action. After hearing the four steps I'm about to explain, many of you will be able to start making money
[00:57] consistently with trading, or, like me, you'll be able to start consolidating your existing profits.
[01:10] support and resistance levels; these are areas where the The price has a high probability of reacting in a certain way, and later I'll explain what you need to look for at these levels. But
[01:23] first, if we go directly to the chart, as you can see, here we have a resistance level and here we have a support level. A resistance level is a point where the price tries to break upwards and can't.
[01:38] tries to break upwards and can't. where the price tries to break downwards and can't. It's
[01:58] two lines; you mark a first line, you mark a second zone. Or rather, and automatically, a level is marked that the price usually reaches to a greater or lesser extent. Here we see how it rejects it. Here we see how it breaks through. And then the
[02:15] price goes back in. Later I'll explain what you need to look for at these levels and how you can predict whether the price will truly break through,
[02:27] as is the case at this point here, whether it will break through in the form of a false breakout, as is the case at this point here, or whether it will reject it, as happens at this point here. And now you know the first point you have to keep in mind, but in
[02:43] reality This doesn't set up a strategy, nor does it establish a foundation for profitable trading. So, that's precisely what we're going to develop little by little in the remaining three points. The second
[02:56] step is to ensure that a trend breaks. The market, in case you didn't know, is fractal, and fractality, according to the RAE (Royal Spanish Academy), is a geometric object in which the
[03:09] same fragmented or seemingly irregular structure is repeated at different scales and sizes. Extrapolating this definition to the world of trading means that any pattern, any structure, any
[03:22] strategy, any advantage you want to trade can be traded interchangeably on a one- minute, one-hour, one-week, or one- month timeframe—it literally doesn't matter what timeframe you choose. Because
[03:37] everything repeats itself in the same way across different timeframes due to the market's fractality, there are different ways to trade. In swing trading, you use a weekly chart; in day trading, you use an
[03:51] hourly chart; and in scalping, you use a one-minute chart. But regardless, you can trade the same strategies across different timeframes. Obviously, what you'll have to do is adjust the
[04:05] chart timeframes; you can't trade... Scalpi is a weekly timeframe strategy, but hey Alex, how do we detect when the trend is breaking? Well, let's go back to the chart, and the first thing you have to
[04:19] do is identify the support or resistance on the daily timeframe. In this case, we have a resistance level that, as you can see, has been holding quite well, both recently (here we have a touch, here we have
[04:33] another touch, here we have another touch, here we have another touch, another touch, another touch) and throughout history. Besides having this, what you have to do next is go down a timeframe, in this case to the
[04:47] one-hour chart, and see how the trend is bullish, and then look for a trend reversal to a bearish trend. But the million-dollar question is how
[04:59] can we interpret when that trend is changing? The market can move in an uptrend, where there will be be
[05:13] downtrend, where instead of higher highs and higher lows, what we will see are constantly lower highs and lower lows; or thirdly, the market can move in a range, where there will be neither an
[05:28] uptrend nor a downtrend because... There's a consensus on the clear direction of the price, and the market is moving without any direction. So, if you want to see a trend reversal, and the market, for example, is falling, what you're
[05:41] interested in is finding a support level and seeing how the price goes from making lower highs and lower lows to making higher highs and lower lows, changing from a downtrend to an uptrend. Listen, and I mentioned
[05:55] do is look for a support or resistance level on the daily timeframe and then look for that trend reversal on the hourly timeframe. Why are we changing the timeframes? Why don't we stay on
[06:09] the daily or hourly charts? Well, it's very simple. If you detect an important level, like a resistance on the daily chart, and instead of executing the trade, you switch to the hourly chart, what you'll be doing is
[06:24] entering a trend reversal before that reaction at the daily resistance level occurs. This means you'll that reaction at the daily resistance level occurs. This means you'll beginner traders and generate much more profit. But let's go
[06:39] back to our previous example, where we left the price at a... The daily resistance level, as you can see, hasn't gone anywhere. Once the price is at that resistance level, what we had to do
[06:52] is go down to the one-hour timeframe, and notice how the market is making higher highs and higher lows. If we replay it, it goes from making higher highs and higher lows through different impulses to forming a large
[07:07] bearish move. So, previous move: low, low, low, low.
[07:22] However, now it has formed a large bearish move that we hadn't large bearish move that we hadn't seen before, and it has also been able to break this trend line. Here we had an ascending trend line,
[07:37] and what the market has done is precisely break that trend line. So, this is precisely where the magic begins. Now you have the basics; you know what you have to see and how you have to see it, but you're still
[07:52] missing a little bit. You're going to be able to make money profitably with this way of trading, and that's exactly what we're going to see see is that you give it a like if you're enjoying the video and subscribe if you are. It's because you
[08:06] comment saying that it's appearing for you... also remember that below, in the first pinned comment and in the description of this same video, you'll find different links of interest such as courses, tutorials, training, etc.,
[08:20] etc. All quality content and 100% free so you can continue training as a trader without having to invest a single Euro. The third step is to wait for a pullback in that trend change, and look, one of the
[08:35] very common mistakes I made 10 years ago when I started is that I would detect a support or resistance level and execute a position without taking into account any kind of rule, strategy, or standard, and I imagine you already know how
[08:50] the movie ended, right? But what happened to me isn't going to happen to you, you might ask. Why, you ask? Well, because in the same way that you know that an upward trend moves with constant rising highs and lows,
[09:04] constant rising highs and lows, you know that a downward trend moves with constant falling highs and lows, so the moment you see that the price forms The first drop, precisely this drop
[09:18] here, what you're going to do is wait for the price to rise a little, for what's happening here to turn around, which is precisely this final part of this upward movement, and then it will be precisely the moment when you're going to execute
[09:34] a position. In this case, notice how the price rises strongly but starts to form candles with shadows, forming a kind of deceleration, and suddenly notice how it creates a bearish candle. Well, that's precisely the point we
[09:50] have to reach, for this bearish candle to form, which can precisely indicate a total trend change so that the price begins a downward movement. that the price begins a downward movement.
[10:05] you know how you have to see it, so you just need to know how to execute this position, and that's precisely what we're going to discuss next. The fourth point is knowing how to enter and how to exit a position. We had left the
[10:21] price at this point where we will execute the market entry. We will also place a stop loss above the recent high and a take profit at a and a take profit at a risk-reward ratio of 3 to 1. Although each
[10:36] one You can choose how you want to exit the position. So, once the parameters are set, all that's left is to wait and let the probabilities take their course. This is the step-by-step guide on how to execute this trading method. It's not intended to be
[10:51] a strategy, but rather a philosophy of trading. And I want you to grasp the concept of fractality. Because really, if you hadn't taken into account what I've mentioned about... Look at the moment
[11:04] we executed the position here: the moment we see a moment we see a resistance level. The price stops and starts to fall. Once it has started to fall, we execute a position, taking a 3:
[11:18] 1 risk-reward ratio. Whoever had wanted to extend this trade longer could have made more money, right? But what would have happened if we had executed it on a daily chart? Let's look at the daily chart. And again, if instead of
[11:33] executing it as we did, taking a 3:1 taking a 3:1 risk-reward ratio, you had waited for the price to stop, as it stopped here on the daily chart, and turn around, which is what we
[11:47] did on the hourly chart, instead of earning a 3:1, you would have... So, the moment you enter a trade using the fractal concept on an hourly chart is the moment you would have executed it on a daily chart. Just as on an
[12:02] would have executed it on a daily chart. Just as on an reverse before executing, on a daily chart you have to do the same: wait for it to slow down and reverse before executing the position. Therefore, you would have executed a
[12:17] position much later without using fractals, you would have executed it far fewer times, you would have obtained a much lower return, and you would have had to pay more commissions because the daily chart is more time-consuming than the
[12:33] hourly chart. So, it's all advantages. It's a trading method or philosophy that doesn't reside in a specific strategy, but rather, as I say, in a way of seeing the market before entering a trade. Remember that below, in the first
[12:47] pinned comment and in the description of this video, you will find different links, all related to 100% free and high-quality trading content. My intention is that you can continue to learn as a trader without having to
[13:00] invest a single Euro, and that is the reason why I upload so many completely free videos. So, take a look at them. In case you are interested, this video... I'll leave it here. I hope you liked it and that it was helpful, which is
[13:13] the important thing. If so, like, subscribe, and share it with friends and family. See you in the next video. Goodbye.
⚡ Saved you 0h 13m reading this? Transcribe any YouTube video for free — no signup needed.