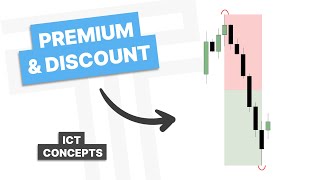

What is Discount & Premium in Trading?
45sClear definition with visual aids, perfect for beginners seeking quick education.
▶ Play Clip"Delivers a solid tutorial on discount and premium with clear examples, though it assumes prior knowledge and includes some filler."
This video explains the concept of discount and premium in trading, which is used to identify favorable risk-to-reward zones within a price range. The presenter demonstrates how to mark out ranges using Fibonacci tools and how to use these zones to find high-probability entry points for long and short positions.
To mark out discount and premium, first identify a prominent range from a swing high to a swing low. Use a Fibonacci tool (e.g., Gann box or Fib) to mark the range.
The 0.5 Fib level is the equilibrium. Anything above is premium, anything below is discount. Extend the box left for better visualization.
There are multiple ranges within price action. New ranges form as price creates new swing highs and lows, which can be confusing but is important for context.
Discount and premium show where risk-to-reward is more favorable. Entering at equilibrium gives a 1:1 risk-to-reward; deeper into discount (for longs) or premium (for shorts) improves the ratio.
For long positions, look for PD arrays (e.g., fair value gaps, order blocks) in discount. For short positions, look for PD arrays in premium.
Identify a range, track it as price expands. When a swing high is put in, look for a discount PD array (fair value gap) to enter long. Price reached the discount and moved higher.
Mark out ranges as price moves. Look for PD arrays in discount for longs. Price reached a discount fair value gap and reversed. New ranges form as price makes new highs/lows.
After a sweep of a lower timeframe low and a break of structure, mark out the displacement range. Look for PD arrays in discount, such as an order block. Price respected the opening price of the order block.
As price makes new highs, track the premium to that high. Price then moved into a discount, confirming the approach.
After filling a daily fair value gap and making a new high, mark out the progressive displacement range. Look for a discount PD array (small fair value gap) for a pullback.
On the 15-minute chart, after sweeping Asia lows and filling the fair value gap, an aggressive move higher created a new discount/premium range. Use an OTE entry for better risk-to-reward (3.43 vs 1.6 at equilibrium).
Price reached the daily fair value gap target and continued higher. The video concludes with a request to like and subscribe.
Discount and premium are powerful tools for identifying high-probability entry zones with favorable risk-to-reward. By marking out ranges and looking for PD arrays in the appropriate zone, traders can improve their trading decisions.
What is the equilibrium of a range?
The 0.5 Fibonacci level.
00:50
What is considered premium in a range?
Anything above the 0.5 Fib level.
00:50
What is considered discount in a range?
Anything below the 0.5 Fib level.
00:50
Why do traders use discount and premium?
To find areas where risk-to-reward is more favorable.
01:44
What is the risk-to-reward at equilibrium?
1:1.
01:44
For a long position, where should you look for PD arrays?
In discount.
02:28
For a short position, where should you look for PD arrays?
In premium.
02:28
What is a PD array?
A price delivery array such as a fair value gap or order block.
02:28
What is an OTE?
Optimal Trade Entry, a specific Fibonacci retracement zone used for entries.
07:26
In the GBP/USD example, what was the risk-to-reward at OTE vs equilibrium?
3.43 at OTE vs 1.6 at equilibrium.
07:41
Equilibrium Definition
Defines the core concept of the video clearly.
00:50Risk-to-Reward Rationale
Explains the practical benefit of using discount and premium.
01:44Trading Rule
Provides a clear, actionable rule for entry placement.
02:28OTE Risk-to-Reward Comparison
Quantifies the advantage of using OTE over equilibrium.
07:41[00:00] How's it going everyone?
[00:12] This video is going to be over discount and premium. However, for this video you have to have a good understanding of buy side and sell side liquidity. So if you haven't already watched my video on that, it will be linked in the top right corner.
[00:24] So the first thing to understand in marking out discount and premium is finding the range. And so for that, I look for a string high to a string low, or essentially the most prominent range in this area.
[00:37] And from there, I will take, in this case, the GaN box, or a SID, and mark out from the high to the low. Doing this, we can see where our equilibrium rests, right here with the 0.5 SID, so this
[00:50] would be the equilibrium of the range. Anything above the 0.5 Fib is considered at a premium and anything below the 0.5 Fib is considered at a discount. So extending this box over to the left we can get a better visualization of where our
[01:06] premium and discount of the range lies. It is important to note that there is not just one range within price action. There are multiple ranges within ranges. For example here we have this range from the sink down.
[01:20] However, when we put an A swing low here and move back up, we create another range from this high to this low. There are multiple different ranges within a set of price action, and it can get kind of confusing,
[01:32] so we'll jump into some examples to explain that. However, I first want to discuss why we use discount and premium. The main reason to be using discount and premium is because it shows where risk to reward is more favorable.
[01:44] For example, if I was to enter a long position right at the equilibrium of the range and put my stop on the low and put my target on the high, my risk to reward would be 1.
[01:57] However, the further into discount I get, the higher or more favorable my risk to reward becomes. The same goes for entering a short position if I was to enter a short position at the equilibrium and put my stop on the high and my target on the low I would have a risk to reward of 1 However
[02:16] as I get deeper into premium, my risk to reward becomes greater. With that being said, if I am looking for a short position, I am looking for PD arrays in a premium to get short. If
[02:28] I am looking for a long position, I am looking for PD arrays at a discount to get long. For For this first example, we are going to look at NASDAQ on the daily chart. And the first thing we want to do is identify a range.
[02:40] Well, we have a singular right here, price leg of. So I'd want to mark out this high to this low. Now, one thing with ranges is they are expanding. So if price moves higher, we're going to track that with our equilibrium range.
[02:56] So as this moves higher, we're going to move it higher with it. We will continue to do that until a high is put in. Now if this is the high, let's see.
[03:10] Okay, so we put in a swing high there. Now if we're going to be looking for long positions, what do we want to look for? We want to look for a discount PD array. Do we have one? Yes, we have a fair value gap right here.
[03:25] So if I'm looking for longs, I want to be looking for longs in here. Let's see what happens. And see we reach into that discount PDArray and then move higher from there.
[03:39] For this next example we are going to look at the dollar index or DXY and the interactions between equilibrium ranges. So if you notice here we have a move up here and so if we mark that out from our high to
[03:55] the low that made the new range, we have our equilibrium range. So with that, let's drop down to the daily. Now from here, if we are looking for long positions or a draw on liquidity
[04:09] for short positions, what would we want to look for? We would want to look for CDRs in a discount So looking into our discount here what do we have Well we have a fair value graph here So letting this play out let see where price heads for And there we go we reach
[04:29] our discount PB array. Now we look, do we have a new range? Yes, we made a range when we went from this high down to this low. So marking this one out. So from here, we'd want to see price reach
[04:43] into a premium of the previous range. So letting a day play out. Now we have a reversal model. So if you look right here, we swept this lower time frame low, we broke structure up,
[04:58] and then if we mark out this displacement range, or this high to this low, we are left with a range that shows premium and discount. So just like before, if we are looking for long positions,
[05:11] I want to look where. I want a PD array and a discount. Well, if I look left, what do I have? I have an order block. So letting this continue, price reaches into here, into a discount and
[05:25] respects the opening price of that order block. Now we expand higher. Well, what do we have now that we made a new range? Well, we can go from our high to our low. Now we have another range.
[05:41] So price was to come back down, I want to see it reach into a discount. And fast forward into the new day, we put in a new high. So I track my premium to that high. And where do we go?
[05:53] Into a discount. For this next example, we have the pound dollar on the daily chart. If you notice, we filled this daily chart value gap, and then we make a new high and
[06:05] we have a progressive displacement range right here. So marking this out from high to low. If price wants to draw back into a discount, do we have a PDA rate in discount for it to
[06:18] reach for? We do. We have a small little fair value gap right here Going to the next day we get a sweep of Monday and Friday high right here It closed back in Next day model wants us to drop down get a reach for that fair value gap
[06:38] So now if I'm going to be looking for longs and a discount, I want to see some sort of rate on previous day low or some sort of setup. Right here, we rate previous day low.
[06:51] close back in and what do we have above us a fair value gap so on the next day I want to see price reach back up so for that we'll go down to the 15 minute chart and look at some price action so if we look right here we start our new
[07:07] day have midnight marked out our Asia range high and low and we sweep this Asia low and all these lows over here filling this fair value gap Then we get an aggressive move higher and so what does that create? It creates another discount and premium range.
[07:26] For this one I will also mark out an OTE. So from here if I was looking for a setup I'd be looking for an OTE entry. And then a target of that daily fair value guys.
[07:41] Maybe notice by entering at a OTE, my risk reward is 3.43 there versus 1.6 at an equilibrium. So I must lay out.
[07:54] Continuing ahead, we reach into our OTE and it's important to notice how there are no candle closes below there, right? It's respecting it. then move higher
[08:08] and then there we go we reach up into that daily fair value gap and we end up going quite a bit higher than that but that is how I would frame a setup. I hope
[08:20] this video helped out with your understanding of discount and premium and if it did please hit that like and subscribe button and I'll see you next time
[08:33] Thank you.
⚡ Saved you 0h 08m reading this? Transcribe any YouTube video for free — no signup needed.