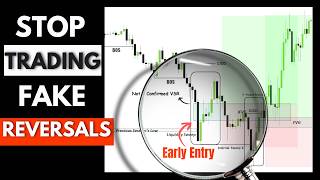

Why Most Traders Lose Money (It's Not Strategy)
44sDirectly addresses the common trader pain point of losing money and offers a clear, actionable solution, making it highly relatable and shareable.
▶ Play Clip"Delivers exactly what the title promises — a clear, actionable breakdown of confirmations before entering a reversal."
This video from Smart Risk explains why most traders lose money due to entering trades too early, and presents four key confirmations to improve entry timing: V-shaped recovery (VSR), change in the state of delivery (CISD), double sweep confirmation, and volume analysis. The presenter emphasizes waiting for these confirmations to align with smart money and avoid false signals.
Most traders lose money not because their strategy is wrong, but because they enter too early. They see a fair value gap, order block, or liquidity sweep and immediately think the trade is ready, but confirmation is missing.
VSR stands for V-shaped recovery. When price drops sharply, grabs liquidity or reacts from a key zone, and then recovers strongly back to its previous level, it forms a V-shape. This indicates a large volume of orders has entered, suggesting smart money may be involved.
CISD (Change in the State of Delivery) is a close above or below the series of bullish or bearish candles that led into a liquidity sweep or key zone mitigation. It helps avoid early entries and filters out invalid V-shaped patterns.
Always wait for a major liquidity side to be taken before applying your trading model. This could be buy-side liquidity above a high or sell-side below a low. Smart money usually needs liquidity before making a real move.
After the first sweep, price may create internal liquidity and then sweep that as well. The sequence is: major HTF liquidity sweep, then internal liquidity sweep, then a market structure shift with displacement.
Volume measures trading activity. Rising volume confirms a move; falling volume may show weakening momentum. Use volume spikes near order blocks and volume divergence to confirm reversals.
What does VSR stand for?
V-shaped recovery
01:49
Why is a V-shaped pattern considered a confirmation of smart money entry?
It signals that a large volume of orders has entered the market, indicating smart money may have stepped in.
02:16
What does CISD stand for and what does it mean?
CISD (Change in the State of Delivery) is a close above or below the series of bullish or bearish candles that led into a liquidity sweep or key zone mitigation.
04:32
Why is waiting for CISD important?
It helps avoid early entries and filters out invalid V-shaped patterns, ensuring the market has confirmed a real change in direction.
05:28
What is the correct sequence for a double sweep confirmation?
First, wait for a major higher time frame liquidity sweep, then wait for an internal liquidity sweep, then a market structure shift with displacement.
09:21
What does rising volume during a trend indicate?
Rising volume confirms the move; falling volume may show weakening momentum.
10:53
How can volume be used to confirm an order block?
An unusual increase in volume around a supply or demand zone adds confirmation that strong orders were executed there.
11:20
What is volume divergence?
Volume divergence is when price moves in one direction but volume bars shrink, indicating weakening momentum and a potential reversal.
12:02
Early entries are the main cause of losses
Identifies the core problem traders face, setting the stage for the solution.
00:01VSR pattern as smart money signal
Provides a clear, visual pattern to spot potential smart money entry.
01:49CISD to avoid early entries
Offers a precise rule to confirm a change in direction, reducing false signals.
04:32Always wait for major liquidity sweep
Emphasizes the importance of liquidity in smart money trading.
07:17Volume as confluence
Shows how volume can validate moves and detect weakening momentum.
10:03[00:01] episode of Smart Risk. Most traders lose money not because their strategy is completely wrong. They lose because they enter too early. They see a fair value gap, an order block, a liquidity [music] sweep, or a small
[00:14] market structure shift, and they immediately think the trade is ready. But the truth is, most of those setups fail because one thing is missing. Confirmation. And that's exactly why in this video,
[00:26] I'll break down some of the most powerful second layer confirmations you can add to your trading model. These confirmations will help you filter weak setups, avoid early entries, and [music] confirm whether smart money is
[00:38] actually entering the market or not. By the end, you'll know how to avoid rushed trades and wait for a cleaner reason to enter. [music] so make sure to give this video a thumbs up. And if you're new here,
[00:51] subscribe to the channel. See you after the intro.
[01:07] started. Clearly identifying whether a setup is truly high quality or not is trading, and that's something we already covered in previous episodes. Those hacks help us filter out risky trades, but they only serve as the first
[01:21] layer of confirmation. If you want to add more confluence, more depth, and more validation to your setup, and truly reach A+ entries, then you need a second layer of confirmation. I personally use four important hacks to
[01:35] depending on the setup. So now, let's go through them one by one in detail and see how to use each of them effectively to reach A+ entries with extra confirmation. Starting with the VSR pattern. VSR
[01:49] stands for V-shaped recovery. The basic idea behind this pattern is simple. When price grabs liquidity or reaches a strong demand zone, it may drop sharply and then recover strongly back to its previous level, forming a
[02:03] clear V-shape. In a bearish scenario, the opposite happens. Price rises quickly, grabs liquidity, or reacts from a key supply zone, and then drops back to its previous level.
[02:16] pattern. A V-shaped recovery shows that a large volume of orders has entered the market. In other words, it may indicate that smart money has stepped in and that a strong reversal could be about to
[02:29] Since we always want to trade in the same direction as smart money, not against it, the V-shaped pattern gives us an extra layer of confirmation and validation before entering a trade. So, the main reason we want to see a
[02:44] V-shaped pattern is that it can signal smart money entry, which may lead to smart money entry, which may lead to strong buying or selling momentum. However, it's important to understand that not every V-shaped price movement
[02:56] Not every sharp drop and recovery should be treated as a true V-shaped recovery the market. We should only focus on V-shaped patterns that form after price grabs liquidity from a major key level or
[03:11] after price reacts from an important supply or demand zone. remember. V-shaped patterns become much stronger when they are formed with inefficiency. In other words, when both the upward and
[03:27] behind regular or inversion fair value gaps, the pattern becomes more reliable and the probability of an upcoming reversal increases. For example, as you can see here, price suddenly drops, forms a swing low, and
[03:42] after tapping into a higher time frame demand zone, quickly rises back to its previous level, creating a clear V-shaped pattern. This move also leaves behind a new demand zone and a fair value gap.
[03:55] This V-shaped recovery shows that price found support at the bottom and was pushed higher by strong buying pressure, suggesting that smart money may have entered the market. So, when this pattern appears,
[04:07] especially alongside a market structure shift, such as a change of character, it adds another strong layer of confirmation and increases the probability of an upcoming uptrend. As a result, you could consider looking
[04:19] for a long position to take advantage of the potential move higher. Now, let's move to the next confirmation hack, CISD, change in the state of delivery. The second hack on our list is CISD,
[04:32] which means a close above or below the series of bullish or bearish candles that led into an internal or external liquidity sweep, or into the mitigation of a key zone. In a bullish scenario, a change in the
[04:45] closes below the body of the first candle in the series of bullish candles that led into the liquidity sweep or higher time frame point of interest mitigation. Similarly, in a bearish scenario, CISD
[04:59] happens when price closes above the origin of the series of bearish candles that led into the liquidity sweep or higher time frame key area mitigation. Adding this extra confluence to your checklist before placing any trade gives
[05:12] out early entries from fair value gaps and inversion fair value gaps inside the mitigation leg or liquidity grab leg. In other words, it helps you avoid actually confirmed a change in direction.
[05:28] On top of that, waiting for CISD helps filter out invalid or early V-shaped recovery patterns and prevents you from making rushed and unnecessary trading decisions. In other words, CISD helps you avoid entering too early before the
[05:42] market confirms a real change in direction. This matters because many traders enter right after a liquidity sweep, thinking the reversal has already started. But price can still move deeper into the
[05:54] higher time frame zone, rebalance more inefficiencies, or even create another begins. So instead of guessing the reversal just because price touched a key level or swept liquidity, CISD allows us to wait
[06:09] for confirmation that the previous delivery has actually changed. That's what makes CISD powerful. It shows that the aggressive move into liquidity or a key zone is losing control, and the opposite side of the
[06:22] market is starting to take over. Now let's move to the next filter, the double sweep confirmation. But before we continue, we're looking for a trusted prop firm with fast and reliable payouts, then you need to check out
[06:35] Funded Next is one of the pioneer prop firms that offers both futures accounts and CFDs all in one place, which gives traders a lot more flexibility. They provide a wide range of challenge accounts starting from $5,000 all the
[06:50] way up to $200,000. They also offer instant funding options, meaning you can challenge phase. And for the Smart Risk community, you can get an exclusive 7% discount plus a 120% account reward, which is only
[07:05] the link in the description. one of the most important rules in Smart Money trading. Always wait for a major liquidity side to be taken before applying your trading
[07:17] That means we do not want to enter just because price reaches a key level, reacts from a zone, or creates a small confirmation on the lower time frame. Before applying our model, we first want to see price take out a major liquidity
[07:32] pool on the higher time frame. This could be buy-side liquidity above a clear high or sell-side liquidity below a clear low. Because smart money usually needs liquidity before making the real move. A
[07:44] lot of traders enter too early while price is still moving toward liquidity. They see a fair value gap, an inversion FVG, a small structure shift, or even a V-shaped reaction, and they immediately assume the reversal has already started.
[07:58] But in reality, price may still be targeting a much larger liquidity pool. So instead of entering in the middle of the move, we wait for price to complete that liquidity run first. Once that major liquidity side is taken,
[08:12] entry model. That already gives us better context, cleaner setups, and a much stronger reason to trust the reversal. stronger. After price sweeps the major higher time
[08:27] frame liquidity, do not enter immediately. internal liquidity created right after that first sweep. In a bullish setup, price may sweep a major low, bounce, attract early buyers, create internal
[08:41] lows, and then come back to sweep those internal lows before the real reversal The same logic applies in a bearish setup. does not always reverse immediately after taking old liquidity.
[08:56] In many cases, price first sweeps the higher time frame liquidity, then clears the newly created internal liquidity, and only after that does the real That means both sides of liquidity have now been cleared.
[09:09] First, the old liquidity resting above or below the major higher time frame level, and second, the new liquidity created by early traders inside the lower time frame order flow. And that gives the setup much more
[09:21] strength and confirmation. So the sequence should be clear. First, wait for the major higher time frame liquidity sweep, then wait for the internal liquidity sweep. After that, wait for a market structure
[09:34] shift or change of character with displacement on the lower time frame. Once displacement appears, you can look for your entry from a fair value gap, order block, or another valid PD array inside that displacement leg.
[09:47] That is what turns a basic liquidity sweep into a high probability smart fourth filter. Volume indicator. displayed as vertical green and red bars at the bottom of the chart.
[10:03] Each bar shows the total trading volume executed during a specific candle It's important to understand that volume measures trading activity, not momentum directly. Green bars usually appear when a candle
[10:16] volume. Red bars usually appear when a candle closes below its open, showing bearish volume. When volume increases during an uptrend, it confirms strong buyer participation
[10:29] and supports continuation. But when volume starts decreasing during an uptrend, it may show that buyers are losing strength, which can lead to a pause, pullback, or even a shift in market structure.
[10:41] The same idea applies in a downtrend. Rising volume during a downtrend confirms strong selling pressure and supports bearish continuation. But falling volume during a downtrend may show that sellers are weakening,
[10:53] which can lead to a pullback, consolidation, or even a potential bullish shift. So, in simple terms, rising volume confirms the move. be losing strength. Now, you might ask, "How can we use this
[11:08] Now, you might ask, "How can we use this indicator to improve our trades?" As you know, order blocks are considered decisional areas where institutional orders may have entered the market before a strong move happened.
[11:20] Because of this, price is often expected to react when it returns to these areas. This is where volume can help. When we see an unusual increase in volume around a supply or demand zone, It adds more confirmation that strong orders were
[11:34] likely executed there. In other words, high volume inside or near an order block can support the idea that smart money was involved in that move. So, before entering a trade, volume can be used as an extra confluence factor.
[11:49] If price creates a strong order block with a clear volume spike and later returns to that same zone, there is a higher chance that price may respect it and react from that area. The second key way we use the volume
[12:02] indicator is by spotting volume divergence as a strong reversal signal. In a bullish move, if price keeps rising but volume bars start getting smaller, it means buyers may be losing strength. Even though price is still moving
[12:16] upward, the buying pressure is not supporting the move anymore. divergence, and it can signal a potential pause, pullback, or reversal to the downside. The same applies in a bearish move.
[12:30] If price keeps falling but volume bars start decreasing, it means sellers may be losing strength. Even though price is still moving weakening. This is called bullish volume
[12:42] divergence, and it can signal a potential pause, pullback, or reversal to the upside. Volume divergence can add extra validation and confirmation to our setup, especially when price is reacting
[12:55] To properly read the volume indicator without being confused and with ease, all we have to do is when the price reaches a key zone on the chart, look for spikes forming in the volume indicator confirming that divergence has
[13:09] This gives us the confluence we need to use as extra confirmation to place use as extra confirmation to place entries. 1-hour chart, price is clearly in a strong downtrend
[13:23] of structure. Then price pushes upward, sweeps the buy-side liquidity above a key swing high, and taps into this 1-hour fair value gap. After filling the FVG, price reacts from
[13:36] it and shows rejection. Now, if we check the volume indicator, we can see that as price continued moving upward toward the FVG, the volume bars started getting This tells us that even though price was pushing higher, buying pressure was
[13:50] weakening. That creates bearish volume divergence. In simple words, price is moving up, but volume is not supporting that move. upward move may be losing strength and that a pause or reversal to the downside
[14:05] could happen. So now, we have the extra confirmation we were looking for. Price swept buy-side liquidity, tapped into a key 1-hour fair value gap, showed rejection, and volume confirmed that buying pressure was decreasing. If you
[14:18] look more closely at the volume indicator, you can also notice a clear volume spike near the reaction area. This spike shows that selling pressure started to enter the market, adding even more confirmation that a bearish
[14:30] reversal may be forming. With these confirmations in place, you can either use a single time frame entry or zoom into a lower time frame and wait for a market structure shift, change of character, or your entry model to open a
[14:44] short position. That's it, traders. Thanks for watching. I hope you found this video valuable. If you did, hit subscribe and turn on notifications so you never miss an
[14:56] Drop a comment below with your thoughts or topics you'd like to see next. Your support means the world to us. See you in the next video.
⚡ Saved you 0h 15m reading this? Transcribe any YouTube video for free — no signup needed.