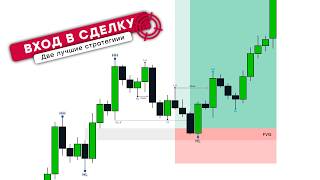

2 Best Trade Entry Strategies
45sDirectly addresses a common trader pain point with clear, actionable strategies.
▶ Play Clip"Delivers solid, actionable trading strategies with real statistics, though the title oversells 'best' and includes a promotional pitch."
This video presents two universal strategies for finding high-probability trade entry points in any market, based on smart money concepts. The first strategy involves entering at the end of an impulse movement (counter-trend), while the second focuses on entering at the completion of a correction (trend-following). The presenter emphasizes the importance of market structure, risk management, and compound interest, backing the approach with 10 months of public trading statistics.
The video teaches how to find the best entry points using universal principles that work in any market situation. These patterns are simple, logical, and appear constantly on charts, used almost daily.
Finding entry points begins with understanding market structure. Two main types: completion of an impulse movement (counter-trend short) and completion of a correction (trend-following long). Identifying the trend on any timeframe tells you where to look for entries.
Entries mid-movement on breakouts or candlestick patterns should be avoided as they are breeding grounds for smart money manipulation.
For an uptrend, identify the ascending structure and trading range from the last higher low to the high. Focus on the discount zone below the 0.5 level, where smart capital shows buying interest.
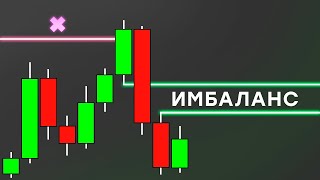
Ensure an imbalance formation (rezerblok) exists. A long transaction is executed by a limit order from the beginning of the imbalance. Stop-loss is placed under the first knot of the imbalance. Two take-profits: first at the last structural high (50% position), second at the beginning of the resistance zone above.
During a correction, smart capital reaccumulates long positions using liquidity under local lows and attracts new liquidity. Buy orders above local highs become fuel for the continuation of the uptrend.
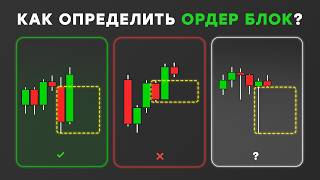
For counter-trend shorts, ensure growth reached a significant institutional resistance zone (e.g., order block) and have a clear downward target (imbalance in discount). Wait for confirmation from M3 Drives or M+ SMT reversal formations.
Look for a structural breakdown (update of structural low) and emergence of a fresh bearish imbalance. These indicate active selling by smart capital.
Place a short limit order at the beginning of the correction, stop-loss behind the first candle of the formation, and take-profit at the first significant support zone. In the example, a classic bearish M pattern confirms the reversal.
The presenter shares a table of all public trades over 10 months. Starting deposit of $10,000 grew to $37,000 (370% increase) through discipline and compound interest. Every trade risked 1% of the deposit.
Aim for a final risk-reward ratio of at least 1:2. The formula for systematic trading: risk 1%, minimum 1:2 R, and compound interest. This ensures steady growth and capital preservation.
The video provides a systematic approach to trading based on smart money principles, emphasizing the importance of market structure, risk management, and compound interest. By following the outlined strategies and maintaining discipline, traders can achieve consistent profitability.
What are the two main types of trade entry points according to the video?
Completion of an impulse movement (counter-trend) and completion of a correction (trend-following).
00:28
Why should mid-movement entries on breakouts be avoided?
They are breeding grounds for smart money manipulation.
01:07
Where is the discount price zone in an uptrend?
Below the 0.5 level of the trading range.
01:35
What is the conservative entry method for a long trade?
A limit order from the beginning of the imbalance.
02:16
Where is the stop-loss placed for a long trade?
Under the first knot of the imbalance formation.
02:41
What are the two take-profit levels for a long trade?
First at the last structural high (50% of position), second at the beginning of the resistance zone above.
02:41
What confirmation is required before entering a counter-trend short?
One of the M3 Drives or M+ SMT reversal formations.
04:17
What are the two factors indicating active selling by smart capital?
Structural breakdown (update of structural low) and emergence of a fresh bearish imbalance.
04:43
What is the recommended risk per trade?
1% of the deposit.
08:07
What is the minimum risk-reward ratio aimed for?
1:2.
08:33
Two Entry Types
Defines the core framework for finding high-probability entries.
00:28Avoid Mid-Movement Entries
Warns against common retail traps.
01:07Limit Order from Imbalance
Provides a concrete, conservative entry technique.
02:16Confirmation for Counter-Trend
Emphasizes waiting for reversal formations to avoid premature entries.
04:171% Risk Rule
Highlights the importance of strict risk management for long-term success.
08:07[00:02] you'll learn how to find the best entry points using universal principles that work in any market situation. These patterns are simple, logical and appear on the chart constantly. That's why I use them almost on a
[00:15] daily basis. At the end of the video, I'll show you public statistics for 10 months so you can see how these methods actually work in practice. Finding entry points always begins with understanding the market structure and identifying
[00:28] areas where the probability of success is highest. The first type is the completion of an impulse movement, when new highs are formed and the market enters a correction phase. In such conditions, counter-trend trades are relevant
[00:40] , providing the opportunity to open short positions with a high probability of success. The second type is the completion of a correction when a structural low is formed . Here, on the contrary, we are looking for a lunging position, following the direction of the main trend.
[00:54] This way, by identifying the trend on any timeframe, you'll always know where to look for an entry point to ensure your trade has the highest probability of success. Entries mid-movement on breakouts or based on candlestick and chart
[01:07] patterns should be avoided as this is a breeding ground for smart money manipulation. In a down market, everything happens in reverse. When forming at the end of an impulse, counter-trend longs are opened. And the transformation of
[01:20] the lower-end to complete the correction of the deal along the short trend. And now we will figure out how to do this consistently, thoroughly and systematically. The work begins with identifying the ascending structure and trading range from the last HRO to
[01:35] the high. This allows us to understand the scope of the future correction and determine where premium and discount prices are. The focus is on the range below the 05C level, the discount price zone. This is where smart
[01:49] capital shows the greatest interest in buying, and our job as a smart money trader is to follow its actions. Next, you need to make sure that actions. Next, you need to make sure that
[02:01] imbalance formation, a rezerblok. Medigation and breaker blocks are much less common and, due to their specific nature, are not discussed in this video. be a local minimum internal pull liquidity price for sale,
[02:16] which smart capital uses for purchases at discount prices. A food transaction is executed by a limit order from the beginning of the imbalance. This is the conservative and most reliable approach, providing the largest number of
[02:29] quality entry points. But if you want to improve your risk/ reward ratio, watch my video on imbalance. Alternative triggers for opening trades are discussed in detail there. Stop-loss is placed under the first
[02:41] knot of the imbalance formation. There are usually two Teikovs. The first one is on the last structural high, where the correction began. 50% of the position is fixed here. The second one is at the beginning of the resistance zone above it. A reversal may start here, so
[02:56] the trade will be closed. Further development shows the formation of a complex correction. A local downward trend appears within the uptrend. The pigclaw is updated and the bullish imbalance is partially rebalanced. This
[03:09] indicates that in the correction phase, smart capital solves two key tasks. Reaccumulates long positions using liquidity under local lows and simultaneously attracts new liquidity, securing the current price as
[03:22] fair. Above each local high, 100 orders to buy are concentrated , the activation of which becomes fuel for the continuation of the upward trend. Thus, smart capital, without putting in much effort,
[03:36] directs the price in the direction it needs and makes a profit. This type of pricing practice that occurs on a daily basis. Entering at the end of an impulse is a counter-trend trade. Our task is to determine the moment at
[03:51] which a new structural high is most likely to form and a reversal to begin. To do this, it is important to ensure that growth has reached a significant institutional resistance zone. for example, urderblock. On the other hand,
[04:04] it is necessary to have a clear downward target that the price will strive for. As a rule, this is an imbalance in the discount market. In such conditions, an expectation of a decline is formed, but to open a deal, additional confirmation is required in
[04:17] the form of one of the M3 Drives or M+ SMT reversal formations. They form at almost every reversal, so entering a trade occurs only after they are
[04:29] formed. This gives us a number of advantages: reversal confirmation, which protects against premature entry, a high-probability and universal setup for a counter-end short position, and a high risk-reward ratio. Two
[04:43] look out for are a structural breakdown when a structural low is updated and the when a structural low is updated and the emergence of a fresh bearish imbalance. These factors indicate active selling by smart capital and its
[04:56] interest in further depreciation of the asset. The first correction is usually the most predictable and deep enough for an optimal entry, so a short limit order is placed at the beginning of the correction, a stop-loss behind the first candle of the formation, and a
[05:10] take-profit at the first significant support zone. In our example, the reversal occurs through the classic bearish M pattern, which is confirmed by the update of the structural HROW. The emergence of a bearish imbalance is a key sign of the emergence of an
[05:23] outgoing overflow, within which our interest in opening a short position arises. In such a situation, a limit order is placed at the beginning of the imbalance. Stop-loss for the first candle of the formation. The first tag is fixed at the local
[05:37] bullet point, the second at the beginning of the zone in the discount market with an even distribution of volume by 50%. During a local correction, a partial rebalancing of the efficiency movement occurs and our transaction is filled.
[05:51] After this, the movement naturally accelerates. This is a typical dynamic after the first correction, and uninformed traders no longer have time to enter at favorable prices. The goals are achieved and the position is completely
[06:04] closed. As you can see, this is one of the simplest and most reliable counter-trend trading approaches that can be applied to any market and timeframe. To help you do this safely and systematically, let's look at risk management and the
[06:17] risk-reward ratio using my example. This table contains all my public trades from the trading group over the last 10 months. Analytics are conducted on a daily basis, and each publication has a simple but systematic
[06:30] structure. The zone of interest, from the beginning of which the entry is made, the scenario cancellation level in the form of a crossed-out eye symbol, behind which a conservative stop-loss is placed. target levels at which profits are taken. Everything
[06:43] is published with plenty of time to allow everyone to have the opportunity to complete the transaction with me. If a column does not have a value, it means that the transaction did not affect the outcome for one of two reasons. It was not opened
[06:56] because the price reached the target without testing the zone of interest. Inside it is displayed as bu. Or the position closed at breakeven. Boo. We didn't lose anything, but we did n't gain anything either. This usually happens due to a partial fixation or
[07:11] stop transfer, which reduces the risk to zero. I started keeping this spreadsheet when I created the trading group. In the starting deposit field, a conditional amount of 10,000 was indicated. This, in my opinion, is the optimal size for most
[07:24] community members. Today it stands at 37,000, representing an increase of more than 370% in less than a year. Solely through discipline and compound interest. Yes, the win rate may not seem high, but
[07:39] for daily trading without selecting only A+ setups, this is a phenomenal result. Well, look at the average one. In any case, if you're capable of trading better, contact the manager, complete the trial period, and we'll definitely
[07:52] work together on excellent terms. The key to this result is absolute stability in risk management. Every trade was opened with a 1% risk and this rule was never broken. The work was carried out with compound interest. If the
[08:07] initial deposit was 10,000, then with a risk of 1% it is 100 dollars. After the first profitable deal, the deposit increased to 10,200. And now 1% is already equal to 102
[08:19] dollars. This is the amount we risk in the next deal. Profits grow not due to an increase in position size, but due to the stability of the system. If 2% profit previously yielded $200, now it's $750.
[08:33] This is the most reliable and effective way to grow capital. And this is exactly what I demonstrate in practice. Now about the risk-reward ratio R. I aim for a final result of no less than 1: d. This is optimal for daily
[08:47] trading. Higher values, such as 1:t or 1:even, are less common and cannot be part of a stable pattern. A simple formula for systematic trading. simple formula for systematic trading. Risk 1%, minimum 1:2 d and compound
[09:01] interest. This is enough to grow steadily and preserve capital. If you're not sure how to open a trade with a fixed 1% risk, watch my risk management video or use my free
[09:14] position size calculator. Enter your parameters, click calculate and get the exact position size. By following this value, you will never lose more than 1% of your deposit. In this video, you'll learn when to
[09:29] look for trade entry points and what information provides the best entry points. The material turned out to be as practical as possible. Even beginner traders will be able to apply it immediately after viewing it. The main thing is to practice risk management and use
[09:42] compound interest. This is the key to systematic and stable earnings in the market. Subscribe to my Telegram channel, where I regularly share my observations, ideas, and current market reviews. Good luck.
⚡ Saved you 0h 09m reading this? Transcribe any YouTube video for free — no signup needed.