
Gaps vs Imbalances: Key Difference
44sClearly explains the crucial difference between gaps and imbalances, a common point of confusion for traders.
▶ Play Clip"Delivers a clear, concise explanation of two trading formations with examples, though it's brief and lacks depth."
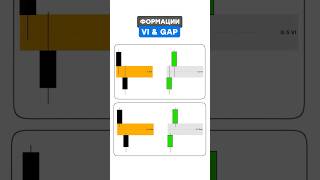
This video explains two trading formations: the 'VI' (volume imbalance) and the 'GAP', focusing on how they form between candle closes and opens, and how traders can use them to predict price movements. It distinguishes between the two by their shadow overlap and provides examples from Bitcoin futures on the CME exchange.
The gap occurs between the closing of the first candle and the opening of the second, where shadows overlap. It acts as a price magnet and resistance zone; price is expected to reach level 0 and continue falling.
Bullish VI forms on rising candles and acts as a support zone, expecting a correction and continued growth.
In a GAP, the lower shadow of the first candle and the upper shadow of the second do not intersect, unlike VI. The range is determined by bodies from close to open, not shadows.
Expect the gap to close by at least 50% and then decline to continue. It acts as a magnet and resistance zone.
In a growing market, the gap acts as a support zone; expect the level to reach 50% and then continue upward.
A gap formed between trading days on the CME Bitcoin futures chart; the price reacted well and growth continued.
A VI formed between close and open; the next day price covered it completely, and upward movement continued. This rebalanced another VI.
Both gap and VI indicate that the market will strive to balance out.
The video teaches traders to identify VI and GAP formations as price magnets and support/resistance zones, using them to anticipate market corrections and continuations.
What is the key difference between a VI and a GAP?
In a VI, the shadows of the two candles overlap; in a GAP, they do not intersect.
00:31
How is the range of a GAP determined?
By the bodies from the closing of the first candle to the opening of the second.
00:31
What is the expected behavior of a GAP in a falling market?
The gap acts as a resistance zone; price is expected to reach level 0 and continue falling.
00:04
What is the expected behavior of a GAP in a growing market?
It acts as a support zone; expect the level to reach 50% and then continue upward.
01:01
What is the core principle behind both VI and GAP?
The market will strive to balance out.
01:46
Key Difference Between VI and GAP
Clarifies the distinction based on shadow overlap, which is crucial for correct identification.
00:31Real Example on CME Bitcoin Futures
Provides a concrete chart example showing how a gap forms and price reacts.
01:16Market Balancing Principle
Summarizes the underlying logic that makes these formations useful for trading.
01:46[00:04] the gap occurs between the closing of the first candle and the opening of the second. In this case, the shadows overlap each other. This is both a price magnet and a resistance zone. We expect the price to reach level 0 and continue to fall. That is, the operating principle is
[00:18] completely identical to a conventional imbalance. Bullish will imbalance is formed on rising candles. This is a support zone where we expect a correction and continued growth. On the right are diagrams with gaps. Here you can see that the lower shadow of the
[00:31] first candle and the upper shadow of the second do not intersect. This is the key difference from will imbalance. In this case, the range itself is determined by the bodies from the closing of the first candle to the opening of the second. It is incorrect to determine gaps solely by shadows.
[00:45] We expect the gap to close by at least 50% and for the decline to continue. It acts as a magnet for price and resistance zones. Here is the same gap, but in a growing market. This is a support zone. We expect the level to reach 50% and then
[01:01] see more options for their formation. Resistance zones are highlighted in orange , support zones in grey. This is a chart of a Bitcoin futures contract on the CME exchange. Here we see the gap that formed between the close of one
[01:16] trading day and the opening of the next. Already on the next candle the price showed an excellent reaction, and the growth continued. Next we see the will imbalance. It also occurs between the close and the opening of a new trading day. The next day
[01:31] the price completely covered it, after which the upward movement continued. When forming this pig, we completely rebalanced another will imbalance. absolutely identical to the classic imbalance. Both gap and will imbalance are
[01:46] that the market will strive to balance out. y
⚡ Saved you 0h 01m reading this? Transcribe any YouTube video for free — no signup needed.