
The 50% Rule: Fair Value in Trading
48sExplains the core concept of fair value and premium/discount zones, giving viewers an actionable rule for entry.
▶ Play Clip"Delivers solid educational content on Fibonacci Premium/Discount, but includes a mid-video subscription plug and some repetition."
This video explains the Smart Money Concepts (SMC) approach to trading using Fibonacci retracement levels to identify Premium (overvalued) and Discount (undervalued) price zones. The presenter demonstrates how to determine optimal entry points, set take-profit targets, and use the OTE (Optimal Trade Entry) zone, emphasizing that price always seeks equilibrium and that buying at a discount is a core principle.
The fair value of an asset in a trading range is the 50% level of the last impulse. Below this is the Discount zone (buying interest), above is the Premium zone (selling interest).
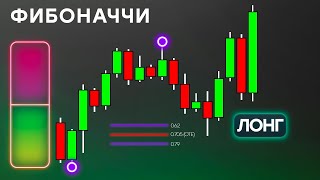
After an upward impulse, stretch the Fibonacci grid from the bottom (start of impulse) to the top (end of impulse). The price should reach the Discount zone before considering long positions.
Always follow the 'buy at discount' rule as it is the main mechanism in the Smart Money concept, combined with all other tools. The market seeks equilibrium, so it delivers the asset to its fair value.
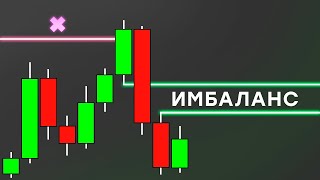
In the Premium zone, open short positions when price removes buy-side liquidity, fills an imbalance, and tests a bearish breaker. In the Discount zone, open long positions when price removes sell-side liquidity and tests a bullish order block.
The OTE zone uses Fibonacci levels 0.62, 0.705, and 0.79, which have the highest mathematical expectation of a price reversal. The optimal entry point is a test of the 0.705 level, but only when there is a strong support/resistance zone in that area.
Price often tests 50% of the range and continues. Learn to see the true reason for reversal (e.g., imbalance, breaker) and decide based on that.
For shorts, stretch Fibonacci from the top (start of downward impulse) to the bottom (end). Expect price to correct into Premium, and if there is a significant resistance zone (e.g., unfilled bearish imbalance, order block), open a trade. First targets are 0 and -0.27.
On the 4-hour chart, after each downward impulse, price returns to Premium, offering short opportunities. Use the buy-at-discount rule in each range to improve position quality.
Smart capital uses buy-side liquidity above highs to close unprofitable long positions and open new shorts. After this, price declines, breaking the local ascending structure.
A zone of interest can consist of a bearish balance (to be filled) and a breaker. During the test, smart capital fixes long positions at breakeven before the main markdown.
For shorts, the next target is sell-side liquidity below the minimum where the correction began. Fix main volume when that liquidity is removed. On third correction, look at where it began and the nearest support zone.
Premium/Discount zones apply to all markets and timeframes. After a downward impulse, wait for Premium to sell; after an upward impulse, wait for Discount to buy.
In a local range, stretch Fibonacci from min to max. In Discount, there is a strong support zone (bullish imbalance and breaker) from which a long position can be opened.
On a lower timeframe, the original target is a bullish imbalance from a breaker in Discount. Until that target is reached, open short-term shorts on each Premium correction when the first lower high is formed.
Correction levels did not play a key role in the examples; they are not a magnet or significant support/resistance. They are only reference points where a reaction might occur, confirmed by other factors.
After a new range forms, focus on Discount support zones. The first problem area for downward pricing is the order block and bullish imbalance. After testing, price forms a new structure and continues higher.
A strong support zone can consist of a re-accumulation block, 50% order block, and unfilled imbalance. The corrective movement reached the last target: 50% of the bearish order block was tested.
Huge sell-side liquidity formed during slow growth will be used by smart capital for future markdown. When the fall begins, stop-losses under each high push price down, providing profit to smart capital and liquidating retail longs.
Use negative Fibonacci values to set take profits. Stretch the grid from the maximum of the correction to the minimum where it started. First take at -0.27, second at -0.62, third at -1.0 (full close). But this is not a panacea.
Use the negative grid only when there is no chart on the left side (price at extreme). Otherwise, determine the current trading range and find significant support/resistance zones for logical take profits.
For upward impulse, stretch Fibonacci from the minimum of the correction to the maximum. Take profits at first three negative values. But always prioritize what's on the chart.
Remember the simple rule: buy at a discount. Spend time on backtesting to understand it well. Be prepared for different price variations.
The video emphasizes that Fibonacci levels are only guidelines, not standalone signals. The key takeaway is to always combine them with Smart Money Concepts like order blocks, imbalances, and liquidity to make high-quality trading decisions.
What is the fair value of an asset in a trading range according to the video?
The 50% level of the last impulse.
00:20
What is the 'buy at discount' rule?
Always open long positions when price is in the Discount zone (below 50% level) after an upward impulse.
01:03
What are the OTE zone levels?
0.62, 0.705, and 0.79.
02:27
What is the optimal entry point in the OTE zone?
A test of the 0.705 level, but only when there is a strong support/resistance zone in that area.
02:53
What are the typical take profit levels for a short position?
First at -0.27, second at -0.62, third at -1.0 (full close).
12:30
When should you use the negative Fibonacci grid for take profits?
Only when there is no chart on the left side (price at extreme of growth or decline).
13:00
What is the main mechanism in the Smart Money concept?
Buy at discount (and sell at premium).
01:03
What does the price always seek according to the video?
Equilibrium of the trading range.
07:00
What is the role of Fibonacci correction levels?
They are only reference points, not a magnet or significant support/resistance; they require confirmation from other tools.
09:13
What is the first target for a short position after opening?
The value 0 and -0.27.
04:18
Fair Value Definition
Establishes the core concept that 50% of the last impulse is the fair value, forming the basis for all zone analysis.
00:20Buy at Discount Rule
The fundamental rule of Smart Money trading that the presenter emphasizes repeatedly.
01:03OTE Zone Levels
Introduces specific Fibonacci levels (0.62, 0.705, 0.79) with high probability of reversal, a key tool for entries.
02:27Liquidity Manipulation
Explains how smart capital uses buy-side liquidity to close longs and open shorts, a crucial insight into market manipulation.
05:16Sell-side Liquidity as Fuel
Highlights how accumulated sell-side liquidity drives future markdowns, showing the importance of liquidity pools.
11:19When to Use Negative Grid
Provides a practical guideline for when to use negative Fibonacci levels, avoiding over-reliance on them.
13:00[00:03] in this video we will analyze Premium Discount prices and zones, I will explain where it is best to open your positions How to determine the potential of a correction and set take profits completion, to open any position, we must always determine the level of 50% of the
[00:20] last impulse, this will be the fair value of the asset in a certain trading range, everything that is below it is prices with the maret zone where we are interested in purchases, and on the other hand there is Premium mat,
[00:36] but in NM, respectively, we are interested in sales to correctly determine Premium and Discount prices, you need to use the Fibonacci correction tool after an upward impulse, the grid is always stretched from the bottom up
[00:51] from the minimum where the impulse began to the maximum where it ended, usually this is done along an ascending structure from to High High on correction, the price should
[01:03] reach Discount Only then can we consider Long positions, the buy at discounter rule must always be followed because this is the main mechanism in the Smart Man concept, which is combined
[01:17] with all the tools we use, the market is in constant search of equilibrium, so it seeks to deliver the asset to its fair value, which implies the beginning of accumulation or fixation of
[01:31] smart capital positions and before we continue I recommend subscribing to my Telegram channel here I write about trading analytics and thoughts on the market in it you will find a lot of useful and interesting information for yourself as a trader
[01:45] information for yourself as a trader Follow the link in the description under the video this diagram shows what you should focus your attention on in any trading range for example in the Premium Market you open a short position when
[01:59] the price has removed liquidity for purchase filled the imbalance and tested the bearish breaker with the opening of a Long position everything is the same the price in the Discount Market can remove local liquidity for sale and test the
[02:12] bullish mation block after which growth will begin and you will open your deal on this basis everything will be shown with examples but before that we will analyze what is the OTE zone we can expand the use of the
[02:27] Premium and Discount Market zones using the Ver Fibonacci grid here Ver Fibonacci grid here the values 062 0705 and 079 are used as the levels
[02:39] that have the highest mathematical expectation of a price reversal they are always in In the Premium Market when you are looking for short positions or in the Discount Market when you are looking for a Long position, the optimal entry point will be a
[02:53] position, the optimal entry point will be a test of the 0705 level, it is simply useless in isolation, the levels shown by themselves are not a reason for a
[03:06] price reversal, a reaction in the ote zone will only occur if there is a strong support zone in it, which usually happens. For example, this could be a bullish imbalance from a breaker, it is also worth considering that the price
[03:20] does not always reach the ote zone, you can often see a test of 50% of the current range and continued growth, learn to see the true reason why the price will reverse in the Discount Market and based on this, you will
[03:35] make a decision Where you will open a deal as soon as the fair value level is crossed or when the price is in the ote zone When considering a short position, everything is similar, you need to stretch the
[03:50] Fibonacci grid from the maximum where the Impulse began in a downward direction to the minimum where it ended, this is your trading range in which you will work. You expect the price to adjust
[04:03] and if there is A significant resistance zone, for example, an unfilled bearish balance and an ORR block, then you open your trade. Where the first open your trade. Where the first targets will be the value 0 and
[04:18] -0.27. I will tell you in more detail about setting take profits using real examples. This is the recent pricing of Bitcoin. Four-hour,
[04:31] after each downward impulse, returns to the correction in the Premium Market, thereby providing you with opportunities to open your short positions. The rule of buying from a discounter in premium should be used in each range in
[04:46] which you trade. You will immediately see changes in the quality of the positions you open. By determining the current trading range from the maximum where range from the maximum where the impulse began to the minimum where it ended, you will
[05:00] see where the Premium market is located. You will be interested in selling in it, but for this you need to determine logical zones of interest from where the price can get a reaction. There are two of them. The first problem area will be imbalance, and the second is the
[05:16] RBC bearish, from which the price got a reaction when it tested it 50%. Pay attention to this manipulation of highs. In this way, smart capital, using liquidity to buy above each high, closes its Unprofitable
[05:31] Long positions and open or re-rent new short positions. After this, we expect the Asset to begin to decline, where the local ascending structure breaks when this Low is updated, and a new trading range is formed, which you
[05:47] can use to open a short position. You will only be interested in what is in the Premium Market. Here you can see a zone of interest consisting of two instruments: a bearish balance that the price seeks to fill and a breaker, during the
[06:03] test of which Smart Capital fixes their Long positions at breakeven before the main asset assessment. Then, a similar trading range is formed in the Premium Market. There is a strong resistance zone consisting of
[06:16] two instruments from the bearish balance and the breaker block, during the test of which Smart Capital Reclinic. Reclinic. Where should we set take profits? The next target
[06:30] for the price will be liquidity for sale below the minimum where the correction began. Therefore, when opening a short position on the first and second corrections, the main volume should be fixed when it is removed. When opening a deal on the third correction, we
[06:45] look at where it began; this minimum and the nearest support zone below it will be your primary targets. Premium ranges IDI can be applied to all markets and timeframes without the
[07:00] price will always strive for the Equilibrium of the trading range. Therefore, after a downward impulse, you wait for Premium prices to sell. And after an upward impulse, you wait for Discount prices; you want to buy at a discount. This is a
[07:15] simple rule that will radically change your approach to opening a position for the better. During this complex correction, we had similar opportunities to open positions, but only in an upward direction.
[07:29] To determine the Premium and Discount zones in the local Trading range, you need to stretch the Fibonacci grid from the minimum where the impulse began to the maximum where it ended. In the Discount Market, there is a strong support zone in the form of a bullish
[07:45] imbalance and a breaker, from which you could expect a price reaction and open a Long position. Now look at how the price corrects after an upward impulse. Here, absolutely the same thing happens as in the previous measures that
[08:00] I showed, only this happens within a local ascending structure, but the price formation is no different. The price at each correction returns to the Premium Market before continuing to fall. This is how it looks on a lower
[08:14] timeframe. The original target The fall is caused by a bullish imbalance from the breaker in the Discount Market. Therefore, until this goal is achieved, we can open short-term short positions on each correction in the Premium Market when the
[08:29] first lower high is formed, the price reached the zone after which the fall continued on a lower timeframe, where the price reacted, it will be possible to find a zone of interest. Where could a short position be considered on the second
[08:44] correction? We see that in the Premium Market there is only one problem area from which it is logical to expect a price reversal, this is the highlighted bearish imbalance inside the order block. When updating this local high, which partially filled the
[08:58] imbalance, you could open your deal with a stop loss for the nearest high, and it will be relevant to fix the profit when updating the minimum from where the correction began and when reaching the first support zone, that is, at the beginning of the bullish
[09:13] imbalance, as a result, the price tested the value of 0.62 and continued to move up. Please note that the correction levels did not play a key role in any of the examples shown; they do not act as a magnet for
[09:28] the price or a significant support or resistance zone; they are used only as a reference point. Where we We can expect a price reaction, confirming this on the left side of the chart. In this case, the price reacted after testing the breaker and the
[09:43] fufi, and not because we reached the new trading range was formed, the price was corrected. I
[10:02] open a Long position, and now we have formed a new trading range. Attention is focused on the Discount Market, namely, on the support zones that are in it. In this case, the first problem area
[10:16] for downward pricing will be the th block and the bullish imbalance. We can expect that after testing our zone of interest, the price will form a new one in structure and continue to move. Higher to the bearish order block, which I showed in the
[10:32] first example. After testing the y block and partially filling the balance with it, upward pricing continued. The trigger point in the form of a 50% order block has not yet been tested, so it will be relevant
[10:47] to do the same as in previous times. We define the trading range from the last Low, where the growth began, to this High in the zone. We see a strong support zone from the instruments, this is the rigation block. 50% block order and unfilled
[11:04] ineffective pricing, which will be our zone of interest for purchases. Ultimately, the corrective movement reached the last target. 50% of the bearish block order was tested. Huge semi-liquidity
[11:19] for sale, which was formed during the slow growth, will be used by smart capital for the future markdown of the asset. When the fall begins, stop-losses under each crowbar will push the price down, providing profit to smart
[11:34] capital. Retail traders who opened long positions with more ambitious goals will be liquidated. As you can see from the examples shown, the price at each correction tends to the Premium or
[11:47] Discount layout. Use this in your trading in combination with other tools with the smartmoney concept and you will immediately see positive results. With the help of the Fibonacci grid, you can also determine where you will
[12:02] fix profits. For this, negative values are applied. There are two versions of the grid that can be used. The second is simplified, but the principle of setting the take profit will be the same. They are set at negative
[12:15] values. You need to stretch the Fibonacci grid from the maximum of the correction to the minimum. Where it started at negative values You can partially or completely fix the profit from your position usually the first
[12:30] the profit from your position usually the first take is placed at -027 the second at -062 and the third at mi1 where the position is closed completely but this is not a panacea placing your orders this way will not always be relevant sometimes the
[12:44] targets will be too high and sometimes underestimated also the risk-reward ratio for an open position is of great importance if I use this method of determining the potential of a future impulse then this is done with the second variation of the grid
[13:00] and only when there is no chart on the left side that is the price is at the extreme of growth or decline in other cases it is enough for me to determine the current trading range as I showed in the previous examples and find
[13:13] significant support or resistance zones that will act as a logical reason for a price reversal Therefore if I have a left side of the chart then I will set my takes in accordance with it I will
[13:27] fix on significant pools and upon reaching the zone of interest to determine the potential of an upward impulse the Fibonacci grid should be attracted from the minimum of the correction to the maximum Where it comes from Take
[13:41] profits are usually set at the first three negative values. I will not devote much time to this topic now because I want you to learn to pay primary attention to what is on the chart and
[13:56] make your trading decisions based on this. You should never rely on Fibonacci levels if they are not in sync with the chart. Remember that this is only a guideline that requires confirmation. In this lesson, we covered
[14:11] important topics that will improve the quality of the positions you open. Remember the simple rule: buy at a discount store. Spend enough time on a K-test to understand it well. Be prepared
[14:26] for different variations in price development that you will definitely encounter. Well, if you learned something new in this video and you liked it, then like it and write comments because this will greatly help promote this video. Well,
[14:41] also, don't forget to subscribe to my Telegram channel. Link in the description.
⚡ Saved you 0h 14m reading this? Transcribe any YouTube video for free — no signup needed.