
Why Liquidity Sweeps Work
50sExplains the core logic behind why liquidity sweeps lead to reversals, appealing to traders seeking deeper understanding.
▶ Play Clip"Delivers on the promise of a live backtest with clear examples, though the 'favorite strategy' claim is subjective and the tool promotion adds some fluff."
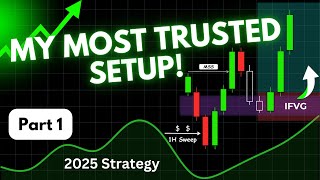
This video demonstrates a live backtest of a trading strategy that combines liquidity sweeps and inverse fair value gaps (IFVGs). The presenter explains the strategy's rules, shows how to use Forex Tester Online for backtesting, and executes two sample trades on the EUR/USD pair, highlighting the importance of multiple timeframes and risk management.
The strategy combines inverse fair value gaps (IFVGs) and liquidity sweeps to create high-probability setups. It requires multiple timeframes: higher timeframe (4H or 1H) for liquidity sweeps, lower timeframe (15m or 5m) for entries.
The presenter prefers 1H for sweeps and 5m for entries. 4H sweeps are more reliable but less frequent; if using 4H, entries should come from 15m.
In a bullish market, price sweeps sellside liquidity (lows of demand zones, swing lows, equal lows) and returns into the range. After the sweep, price often reverses upward, resuming the trend.
After a liquidity sweep, drop to lower timeframe to find a violated fair value gap (FVG) that flips into an IFVG. This acts as new support/resistance and provides entry confirmation.
Two entry options: (1) at the highest/lowest point of the IFVG, or (2) at the consequent encroachment (midpoint) for better risk-to-reward.
Forex Tester Online is used for backtesting, offering real-time data, customizable charts, and features like market crash scenarios and prop firm challenge simulation.
The presenter sets up a project with EUR/USD, $20,000 initial deposit, and selects a time period. Leverage and timezone are configurable.
Forex Tester includes built-in crisis scenarios (e.g., COVID crash, Brexit) to test strategies under stress. Prop firm simulation allows testing against real prop firm rules.
On EUR/USD 1H chart, price sweeps buy-side liquidity above a high and reverses. On 5m, a bearish IFVG forms. Sell order at IFVG low, stop above swing high, target 3R (trend-aligned). Trade hits target.
After a bullish market structure shift, price sweeps buy-side liquidity above two highs and returns. On 5m, a bearish IFVG forms. Sell order at IFVG low, stop above swing high, target 2.5R (counter-trend). Trade hits target.
The strategy shows promise in backtesting, with both example trades hitting their targets. The presenter plans to continue testing and share full results in part two.
What are the two components of the strategy?
Liquidity sweeps and inverse fair value gaps (IFVGs).
00:54
Which timeframes are recommended for identifying liquidity sweeps?
Higher timeframes like 4H or 1H.
01:23
What is the consequent encroachment?
The midpoint of the fair value gap, used for a more refined entry with better risk-to-reward.
03:56
What is the purpose of the prop firm challenge simulation in Forex Tester?
To backtest strategies using real prop firm rules (profit targets, drawdown limits) before spending money on a real challenge.
05:58
In the first trade example, what was the risk-to-reward target and why?
3R because the trade was in the direction of the overall trend.
10:02
In the second trade example, why was the target set to 2.5R?
Because the trade was against the current trend, so a conservative target was used.
12:23
Strategy Core Concept
Defines the exact combination of patterns that form the basis of the strategy.
00:54Timeframe Hierarchy
Explains the importance of using multiple timeframes for higher probability setups.
01:39Entry Refinement
Provides two entry options, allowing traders to balance risk and reward.
03:44Prop Firm Simulation
Highlights a unique feature that lets traders test against real prop firm criteria.
05:58Live Trade Execution
Demonstrates the strategy in action with a successful trade, validating the approach.
08:12[00:02] episode of Smart Risk. There are tons of strategies floating around online, but how often do you actually see someone put them to the test in a live session? Well, that's exactly what we're doing in this episode. I'm going to back test one
[00:15] of my absolute favorite trading setups right in front of you in real time and show you step by step how to apply this powerful strategy directly on your chart. Everything will be broken down into clear, actionable steps. So by the
[00:29] complete road map to confidently use this strategy. We always appreciate your thumbs up and subscribe to our channel if you are new. See you after intro.
[00:42] if you are new. See you after intro. >> No, I don't shaken. If you want to play this, >> welcome back traders. So let's get started. Let's first break down the
[00:54] strategy we'll be testing in this video. This is one of my top favorite trading setups built around the concept of inversed fair value gaps and liquidity sweeps. By combining these two powerful patterns, we create a high probability
[01:09] strategy that delivers consistent results. And you'll see exactly how in this video. To properly apply this trading plan, you need to use multiple time frames in order to get the highest probability
[01:23] setups. Start with a higher time frame to analyze overall market conditions and identify valid liquidity sweep patterns such as the 4our or 1 hour charts. Then switch to a lower time frame to zoom in for confirmation signals and entries.
[01:39] Typically the 15minut or 5-minut charts. Personally, I prefer using the 1 hour time frame to spot liquidity sweeps and then drop down to the 5-minut chart to find any inversed fair value gaps for entry. The 1 hour provides more frequent
[01:54] patterns compared to the 4hour, which is great for active traders. However, keep in mind liquidity sweep patterns that form on the 4 hour are generally more reliable and higher in quality. So, if you decide to work with the 4hour time
[02:08] frame for identifying sweeps, then your entry and confirmation should come from the 15minute chart instead. In a bullish market context, this setup plays out when price sweeps sellside liquidity, such as the lows of a key demand zone, a
[02:22] major swing low, or a cluster of equal lows, and then immediately returns back into the range of that level. Once that liquidity has been taken out, price often reverses sharply and continues moving upward, resuming the
[02:35] continues moving upward, resuming the bullish trend. Now, you might ask, what makes this setup powerful? For example, in a bullish market, when price sweeps the lows or a key demand zone, there's no more sellside liquidity
[02:48] left to grab. That increases the probability of a sharp move toward buyside liquidity, aligning with the overall bullish narrative. So after identifying a valid liquidity sweep on the higher time frame, our next approach
[03:02] is to zoom into the lower time frame like five or 15 minute time frames to search for a violated fair value gap and formation of an inversed fair value gap. That's your first layer of confirmation. Once you spot the inverted fair value
[03:16] gap which will hold and act as a new support or resistance level, the next step is to execute your trade based on it. Additionally, if price forms a adds another powerful layer of confluence to strengthen the setup. With
[03:31] all these confirmations in place, we can now anticipate that price will return to the zone of the inversed fair value gap, which now acts as resistance or support before continuing to target the next liquidity pool. For executing this
[03:44] options based on how aggressive or conservative you want to be. Option one, or highest point of the inverse fair value gap.
[03:56] Option two, use a more refined entry and place your order at the consequent encroachment, which is the midpoint of the fair value gap. This option usually gives you a better risk-to-reward ratio. So, now that we've fully covered all the
[04:10] rules, details, and everything you need to know about this strategy, it's time to put it to the test. In the next part, we're going to back test it and see how well it actually performs. To back test my strategy, I'm using
[04:25] Forex Tester online, a powerful simulator with real-time market data, customizable charts, and unique back testing tools. Before we dive into testing the strategy, let me quickly show you how to use Forex Tester online
[04:38] to back test your own setups. To start your back testing journey, the the new project button and create a new project. From the left corner, you can you'd like to back test your strategy with. As you can see, there are plenty
[04:54] of pairs available to choose from. I'm going with the Euro dollar pair for this example. Next, enter a name for your project and then set your initial project and then set your initial deposit. I'm setting mine to $20,000.
[05:07] Now, choose the time period you want to back test. The tool provides real-time historical data going back several years, giving you a solid range to work with. In the lower section, you can also enter your current time zone and set the
[05:19] leverage you plan to trade with. Once everything looks good, just hit the create project button and you're ready to go. Forex Tester also offers several built-in market crash and crisis scenarios. Each one simulates the real
[05:32] conditions during major financial events, allowing you to see how your strategy would perform in high stress environments. From the CO 19 market crash to the Brexit referendum shock, these scenarios give you a powerful tool
[05:45] to test and strengthen your strategy under extreme market conditions. And here's my favorite feature they've recently added, the prop firm challenge simulation. This tool lets you back test your trading strategy using the exact
[05:58] same rules and criteria used by real prop firms. You can create a custom challenge with your preferred account size and set realistic challenge parameters like minimum trading days, profit targets, maximum daily loss, and
[06:11] overall draw down limits, just like an actual prop firm would require. It's the perfect way to test your skills before spending money on a real challenge. You'll see whether your strategy is solid enough to pass and where you might
[06:24] need to improve so you're better prepared for the real thing. Now once we move to the chart, this is the main workspace you'll be using. You are greeted with a userfriendly chart interface packed with all the drawing
[06:36] tools you need on the left hand side. You can even activate replay mode just by hitting the play button. Perfect for simulating market conditions step by step. From the indicators tab, you can add any indicator you like, including
[06:50] add any indicator you like, including trading session overlays. one-click trade buttons on the top left. For example, if you want to open a short
[07:03] position, enter your trade size and click the red sell button. Simple as click the red sell button. Simple as that.
[07:16] profit and loss will update right on the chart, just like real trading. Below the chart, you can monitor and manage all your open positions. Every order, every detail clearly displayed. Want to review your performance? Just open the history
[07:32] tab to see your trading stats and current capital. And if you want to go deeper, click on the analytics tab in the top right corner to unlock full performance analysis with detailed charts and metrics to help you track and
[07:46] optimize your strategy. The platform even includes economic news integration and tons of additional features, all designed to give you the most realistic and reliable back testing experience possible. So, if you're ready
[07:59] to explore professional level back testing with powerful tools, check out the link in the description and grab a 5% discount with our exclusive promo code. Now, let's kick off the back test. For
[08:12] this session, I've chosen the Euro Dollar pair. It's one of the most liquid perfect for testing strategies with realistic results. I'll be using two time frames. The 1 hour chart for
[08:24] analyzing market structure and spotting liquidity sweeps, and the 5-minut chart for entries and getting confirmation signals. My initial account size is set to $20,000, and I'm sticking to smart risk management by risking no more than
[08:38] 2% per trade. Let's see how this strategy performs in a real back testing environment. Here we are on the Euro Dollar 1 hour chart and as you can see the overall trend is bearish. Recently price has entered an
[08:54] accumulation phase moving sideways and building liquidity trying to decide which direction to move next. Let's play the chart forward and see Let's play the chart forward and see what happens.
[09:10] liquidity above this recent high, then immediately reverses and drops back below the highs range. That's our first major clue. Now, let's zoom into the 5-minute chart to dig deeper and see if we can find an
[09:23] to dig deeper and see if we can find an inversed fair value gap setup. after sweeping liquidity, price violates this bullish fair value gap. Once that
[09:36] happens, this zone flips and is now likely to act as resistance, forming what we call an inversed fair value gap. Now, we've got everything we need. Liquidity sweep and an inversed FVG setup aligned with the higher time frame
[09:49] trend. So, here's the plan. I'll set a sell order at the lowest point of the inverse fair value gap. Stop loss will go a few pips above this swing high.
[10:02] risk-to-reward level. Since this trade is in the same direction as the overall market trend, if this setup was going against the trend, I'd scale back and go for maximum amount of 3R to R instead just to stay conservative.
[10:24] Right after entry, price reversed with strong bearish momentum, pushing down exactly as we anticipated. And finally, it hit our take-profit level perfectly. Now, let's continue playing the chart and look for more
[10:37] playing the chart and look for more trade opportunities.
[11:06] lower, breaking structure after structure to the downside. But right here, we have a bullish market structure shift. As price closes above the most recent swing high, that shift flips the script. And now the overall trend has
[11:19] turned bullish. Let's keep the chart rolling.
[11:36] large green candle that sweeps the buy side liquidity right above these two major highs and then instantly returns back below their range. That's our back below their range. That's our classic liquidity sweep pattern.
[11:53] frame and check if a bearish inversed fair value gap is setting up. Now, here on the 5-minut chart, take a closer look. After the sweep, price breaks through this bullish fair value gap, completely violating it. And that
[12:09] gives us exactly what we were looking for, a bearish inversed fair value gap, for, a bearish inversed fair value gap, locked and loaded.
[12:23] lowest point of the inverse fair value gap. I'll place my stop loss a few pips above this swing high. And since we're shorting against the current trend, I'm going for a 2.5 reward to risk target instead of pushing for more.
[12:46] Now, let's play it out and see what happens.
[13:12] triggered. Price dropped instantly and it cleanly hit our takerit level. That's it for today, traders. I'll continue back testing this powerful trading plan and I'll share the full back testing procedure and results in part two of
[13:25] this video series. So stay tuned for that. Thanks for watching. I hope you found this video valuable. If you did, make sure to hit subscribe and turn on notifications so you never miss an update. Also, drop a comment below. Let
[13:38] me know your thoughts or suggest any topics you'd like to see in the next videos. Your support means the world to us. See you in the next
⚡ Saved you 0h 13m reading this? Transcribe any YouTube video for free — no signup needed.