
3 Drives Pattern: The Secret to Reversals
60sDirectly explains the core concept of the pattern and promises actionable trading insights, appealing to traders seeking an edge.
▶ Play Clip"Delivers a solid breakdown of the Three Drives Pattern with practical examples, though some filler and self-promotion."
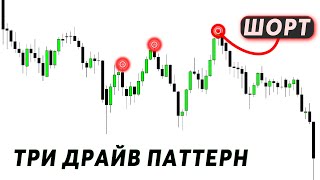
This video is the second part of a series on the Three Drives Pattern (3DP), a common reversal pattern in trading. The presenter explains how to identify and trade both bullish and bearish 3DP formations, emphasizing the importance of context, support/resistance zones, and divergence. Using examples from Bitcoin and currency pairs, the video demonstrates entry points, stop placement, and risk-reward ratios, and highlights the pattern's prevalence across timeframes.
The video analyzes the Three Drives Pattern (3DP), a reversal pattern consisting of three movements. It is a continuation of a previous video on 3Taps, and viewers are advised to watch the first part first.
Confirmation of the setup is a breakdown of the structure, after which there is the best opportunity to enter a position.
In a bullish 3DP, there is an aggressive downward move, then price manipulates lows (updates minimum and consolidates back above). If price consolidates below the minimum, it's likely a downtrend continuation. Manipulation collects liquidity before reversal.
For high efficiency, bullish 3DP should form near support zones, bearish near resistance. Divergence is a strong additional factor indicating trend weakness.
In a bullish trend, a correction formed a 3DP pattern. Since there was no support test, an aggressive move is not recommended. Instead, wait for structure break and use Fibonacci to find discount zone.
On the 12-hour chart, entry points include covering the imbalance (1:3 risk/reward), after absorption of the candle that removed liquidity (1:4), and from the order block at the lower border of the range (1:9).
Traders don't have to adapt to 3Taps; they can work according to structure and consider positions at support areas. There are many entry points across timeframes.
A global bearish 3DP formed near all-time highs. Since there is no resistance, the pattern is used via structure breakdown. Divergence (higher highs on price, lower on indicator) indicates high probability of working out.
On the daily chart, almost every significant movement is a 3Taps or 3DP. On lower timeframes (e.g., 4H), they occur multiple times daily, so learning to find them is essential.
On EUR/JPY, a bearish 3DP formed within a correction. The premium zone and order blocks were used to find short entries. The price manipulates highs, forming liquidity below, indicating distribution.
First entry at test of order block on third drive, stop behind it, targeting lower border of range. Risk/reward is 1:9. Consistent trades of 1:3 or 1:4 can be profitable.
Price returned to ATO zone, covered imbalance, and moved in the general direction. Entries from order blocks are natural. Understanding price direction and tools is key.
The Three Drives Pattern is a powerful reversal pattern that appears across all markets and timeframes. By combining pattern recognition with context, divergence, and proper risk management, traders can find high-probability entries with favorable risk-reward ratios.
What is the Three Drives Pattern?
A reversal pattern consisting of three distinct drives or swings, often forming before significant market moves.
00:02
What does 'manipulation' mean in the context of this pattern?
When price updates a minimum (or maximum) and then consolidates back above (or below) that level, collecting liquidity before reversing.
01:23
What is the confirmation of a Three Drives setup?
A breakdown of the structure.
01:10
Why is context important for the Three Drives Pattern?
Bullish 3DP should form near support zones, bearish near resistance, to increase the probability of success.
01:50
What additional factor indicates trend weakness in a 3DP?
Divergence between price and an indicator.
02:04
What is the risk/reward ratio for the first entry point in the bullish example?
1:3.
03:39
What is the risk/reward ratio for the entry from the order block at the lower border of the range?
1:9.
04:07
How often do Three Drives Patterns occur on lower timeframes?
They occur literally every day and even several times a day.
06:09
Manipulation as Liquidity Collection
Explains the core mechanism behind the pattern: price manipulates lows/highs to collect liquidity before reversing.
01:23Context and Divergence
Emphasizes that context (support/resistance) and divergence are critical for high-probability setups.
01:50Risk/Reward of 1:9
Demonstrates the potential of a well-placed entry, showing a 1:9 risk/reward ratio.
04:07Patterns on Daily and Lower Timeframes
Highlights that 3DP appears frequently across timeframes, making it a versatile tool.
05:41[00:02] in this video we will analyze in more detail the most common reversal pattern in the last video we already analyzed 3taps, this is what we will talk about, the three drives pattern, whoever did not watch the first part, be sure to do so before
[00:15] watching this video on the chart where the numbers one, two, three are shown, bullish and bearish three drives pattern, I show all the examples on one time frame and in one range only to show you how these patterns are often
[00:29] formed on the charts before any significant movement and it does not matter whether it is Bitcoin or any currency pair, what I show here will work in any market and at any time share this and the previous video with friends and
[00:42] acquaintances I believe that such common and basic patterns should be known to everyone and before we begin I recommend subscribing to my telegram channel here I will describe about trading analytics and thoughts on the market in it you
[00:56] will find a lot of useful and interesting information for yourself as a trader, see the link in the description of the three drives pattern, this is a pattern of 3 movement visually it is It will look like a high or a break and then a return to the other side.
[01:10] Confirmation of this setup will be a breakdown of the structure, then I will have the best opportunity to enter a position. Let's start with the former 3ds pattern. In this case, there was an aggressive downward movement, after which the price began to
[01:23] manipulate the layers. The word manipulation means when the price updates the minimum and then consolidates back above niva. In other words, they collect liquidity and then reverse. If the price updates
[01:36] the minimum and consolidates below it, then most likely it will just be a downtrend. It is most likely it will just be a downtrend. It is seeing a continuation of the downtrend and, conditionally, the 4th break is very high. But it is
[01:50] also very important to take into account the context for high efficiency of pattern execution. Bullish TDP should form near the support zone, and bearish resistance zones. Also, a strong additional factor will be the presence of divergence, so
[02:04] pay attention to this. This will indicate the weakness of the trend. In these two examples, there is no significant support zone in the bearish pattern, and resistance zones are in the bearish one. Because I want to show how to work in such a situation, and then
[02:17] we will consider an example that will be It's more efficient to work, and so on a bullish trend, a correction began and the price formed a custom 3DS pattern. It was former because there is manipulation of the pit, therefore, when
[02:29] manipulation of the highs occurs, a bearish pattern is formed. But in fact, the price has not tested any support area. Therefore, an aggressive move should not be considered because the probability of catching an unjustified stop will be
[02:42] increased by the USN and there is potential for an even lower movement. In such a situation, after three interruptions, you should wait for the structure to break and then look for an entry into a position. For this, we stretch the Fibonacci from Louis X and determine the discount zone, and in
[02:57] it we look for a specific area from which we will consider entering the position. In this case, the support zone will be the maximum balance order over oil. Now I will show you what it looks like. Here the imbalance was covered, after
[03:11] which the rally began. Excellent work. But let's return to the 12-hour timeframe, where I will show this correction and the opportunity for entry. If you carefully watched my previous video about the 3taps stage, then it was not a problem for you
[03:25] to find an entry in this situation. There was an update here. previous minimum and then return read with 1 entry point was to cover the balance and a conservative stop would be three bodies and the risk/reward ratio is 13. An
[03:39] trades with greater potential, so we consider a second entry point after the absorption of the candle that removed liquidity and the stop is accordingly placed behind it. The potential of this trade will be one to four, which is already better, but in
[03:53] any case, we still have the opportunity to enter for a retest and the lower border of the range. I highlighted the order block and it will be acceptable to enter from it, but the stop is also placed at the ashes of the candle that removed liquidity and already in this trade the risk/
[04:07] reward ratio will be 1 to 9. That is, if you enter with a risk of one percent, you can potentially take nine percent, phenomenal. Well, don't think that we necessarily have to adapt to 3taps, it may not exist. Just
[04:21] work according to the structure and consider opening positions 1 than their support areas when trading bullish days, but in fact, there are much more entry points. timeframes and analyze them now. Every opportunity because I already had a
[04:36] video on how to enter a trade, so I recommend watching it and it already has tips. Now let's look at the bearish three drives pattern, which will be more global. It formed almost two months ago, but
[04:48] subsequently we saw an excellent result. Here you can see a similar picture as in the previous example, only in the opposite direction, the price is manipulated by highs on the left side. A priori, there is no zun or resistance because this is the
[05:01] all-time price maximum. Therefore, the use of the pattern will be purely through the breakdown of the structure as an additional factor for your analysis at the formation stage of the 3rd transition. You could pay attention to the divergence.
[05:15] This will indicate the weakness of the trend. As you can see on the chart, the maximum is higher and higher, and on the indicator they are decreasing. This will be a bearish divergence on a bearish pattern, so the probability of working out will be high.
[05:27] After you saw the dream structure, you can determine the premium zone and in it consider opening a position at the resistance zone. The price formed a bearish 3taps, after which the downward trend continued. In the previous
[05:41] video, this situation was analyzed in detail with variations for entering a position, so now Let's switch to the daily timeframe to look at this range for an encore. As you can see, almost every significant movement, a trend reversal, or
[05:55] its continuation, is a 3-taps stage or three drives Potter. If you switch to lower timeframes, at least 4 hours, Victa will have many times more of them. They occur literally every day and even several times, so I believe that it is
[06:09] imperative to learn how to find them and use them for your own purposes. Let's move on to the next example. Let's look at currency pairs. The euro/yen chart on a downward pattern within the correction for the formation of laurels. This is an excellent
[06:23] example that allows you to open effective positions in the direction of the trend. When the correction began, the muzzle was to determine the premium zone and look for specific areas in it from where the price could potentially reverse and
[06:36] continue downward. However, this is not where the maximums are located, which serve as the target for the price, and above them, the balance maximum order. The price will always strive to fill the imbalance. Therefore, one could assume a movement
[06:48] in this area to search for a short position. The price manipulates highs and forms liquidity from below. These are signs of distribution. You also You can pay attention to the moment, in principle, this should happen automatically. Okay, the first
[07:01] entry point will be a test order block on the third transition stop, accordingly, and an attack on the lower border of this range is placed behind it, but this depends on the chart itself and your trading system. It is not always worth trying to catch the entire
[07:15] movement on this trade. The risk-reward ratio will be 1 to 9 with one secret. This is a very good tray. If you manage to open such trades at least once a week and before that, do not catch 10 stops, then you will be profitable. But I would
[07:28] not expect big money, and also consistently earned on trades 1 to 3 or 14 after that, a local downward trend began to emerge. We see here a louvre lo-lo top and another catch. The price returned to the ATO zone, it
[07:43] covered this imbalance and moved towards the general direction of the price. This is effective pricing. But further I see an entry from the medications block and everything is natural. If we consider lower timeframes,
[07:56] there will be many more entries, but even based on oil, you can notice that there are opportunities to enter The most important thing is that you have an understanding of the general price direction and how the tools we use work. Then you simply should
[08:11] n't have any problems finding these steps and successfully applying them in completely different contexts. I hope these videos were as useful as possible for you and you learned a lot for yourself. Before accepting
[08:23] any of the information in these videos, be sure to conduct fundamental work on history before using it on a real account. Thank you all for watching. If you learned something new, please like and
[08:36] This helps promote the video. And also, subscribe to my Telegram channel and Instagram. I remind you that the link is in the description under the video. Good luck under the video. Good luck [music]
⚡ Saved you 0h 09m reading this? Transcribe any YouTube video for free — no signup needed.