

Only 10% Win Rate? Tested 3,000 Trades
45sThe shocking low win rate and high payoff contrast creates curiosity and debate among traders.
▶ Play Clip"The title accurately reflects the low win rate and large number of trades tested, though it slightly exaggerates the surprise factor."
This video presents a trading strategy for the futures index using Bollinger Bands and exponential moving averages on a 15-minute chart. The strategy has a low win rate (around 10-30%) but a high payoff, resulting in a consistently rising equity curve over 10 years of backtesting. The presenter demonstrates how adjusting the target and stop-loss parameters can significantly improve the risk-reward ratio.
The strategy uses Bollinger Bands (20,2) and two exponential moving averages (50 and 200) on a 15-minute chart. It operates from 10 AM to 4 PM, closing any open trades at 5 PM.
For a buy entry, the price must be above both moving averages, and the 15-minute candle must close above the upper Bollinger Band. Entry is at the market open of the next candle.
Default stop loss is 300 points, target is 1000 points. No trailing stop or break-even is used.
For a sell entry, the price must be below both moving averages, and the candle must close below the lower Bollinger Band.
Over 10 years, 2700 trades: profit factor 1.28, win rate 31.81%, payoff 2.73, drawdown 6.84%.
Increasing target to 1500 points improves payoff to 3.20, drawdown 7.86%. Target 2000: payoff 3.39, win rate 27.69%. Target 3000 with stop 200: payoff 5.28, win rate 20%, steep equity curve.
Stop 100, target 3000: payoff 11.45, win rate 10.40%, equity curve still rising. Scalping (target 30) fails despite 93% win rate due to low payoff.
The strategy works best with wide targets (1000-3000) and moderate stops (200-300), not for scalping.
This low-win-rate, high-payoff strategy can generate consistent profits over the long term when applied correctly. The key is to use a wide target and a relatively tight stop, avoiding the temptation to scalp.
What are the three indicators used in this strategy?
Bollinger Bands (20,2), exponential moving average of 50 periods, and exponential moving average of 200 periods.
00:50
What is the trading time window for entries?
From 10:00 AM to 4:00 PM.
01:21
What is the condition for a buy entry?
Price must be above both moving averages, and a 15-minute candle must close above the upper Bollinger Band.
01:33
What is the default stop loss and target?
Stop loss of 300 points, target of 1000 points.
02:26
What is the win rate and payoff for the default parameters?
Win rate 31.81%, payoff 2.73.
05:13
What happens to the equity curve when the target is increased to 3000 and stop to 200?
The equity curve becomes steeper, with a payoff of 5.28 and win rate of 20%.
07:36
What was the result of scalping with a target of 30 points?
It failed: 93% win rate but very low payoff, resulting in a poor equity curve.
09:30
What is the maximum drawdown for the default strategy?
6.84%.
05:26
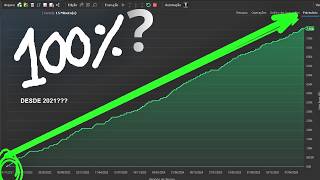
10-Year Rising Equity Curve
Demonstrates the long-term consistency of the strategy despite low win rate.
00:01Low Win Rate, High Payoff
Illustrates the core principle: small losses, large wins.
05:13Optimization with Tight Stop
Shows that a 200-point stop with 3000-point target yields a 5:1 risk-reward ratio.
07:36Scalping Failure
Confirms that the strategy is unsuitable for scalping despite high win rate.
09:30[00:01] institutional strategy. The capital curve has been rising for 10 years now. The success rate is low, but the payoff is high. It generated an extremely upward capital curve for us . In today's video , I'm going to show you a setup using
[00:17] traditional way that has generated excellent results for us over 10 years of backtesting. This is a setup where when you lose, you lose little; when you win, you win big. Look at this. The target here was 1000 points, and it's still possible
[00:33] 2000 points, as I'll show you throughout the video. we'll need to implement this strategy is Biger bands with a standard
[00:50] deviation of 2, a period of 20, and an arithmetic pattern. It's a standard model. So when you insert the Bing Bands into your chart, it will already come with this pattern here. We will also use an exponential moving average of 200 closings and an exponential moving average
[01:05] of 50 closings. When you insert these indicators into your chart, you'll see this screen here. This setup operates on both buy and sell positions on the 15-minute chart. Entry is possible from 10:00 AM to
[01:21] 4:00 AM. This will be the robot's operating hours. And if there is an open trade, starting at 5 PM, the robot will close that trade. I'll explain to you how this setup will
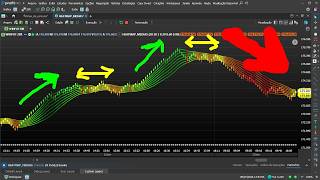
[01:33] work during the purchase. Look, starting at 10 AM, all we want is for the price to be above those two averages. This green average is the 50-period moving average, and this red average is the 200-period moving average. All I
[01:46] need for this buying opportunity to materialize is for the candle's closing price on the 15-minute chart to be above the upper boiling point line. See? What we want is a price explosion. From the moment I
[01:59] have this candle closing above the upper Borger line and logically the price above these two averages, I have a perfectly formed buy entry. All I'm going to do is wait for this
[02:14] candle to close. When it closes, I'll go straight to market at the opening of the next candle. Like this. From the moment I enter, I'll place moment I enter, I'll place a stop loss of 300 points and a target of 1000
[02:26] points, exactly as you can see here. Target of 1000 points, stop of 300 points. Now I'm going to show you in this video that it's possible to make changes. Instead of using a target of 1000 points, I can use, for example,
[02:40] a target of 1500 points or even 2000 points. Once the entry has been made, all we have to do is wait for the target or stop to be executed, since this setup does not use either break even or trailing stop. It's a very
[02:54] simple setup. He entered the buy operation, positioned the target, positioned the case, you realize that the target has been case, you realize that the target has been hit.
[03:10] low success rate. So, most of the time, what will happen is that the stop loss upward trend, this setup will provide many interesting opportunities. Here you can see that he entered the buy order and the target of 1000 points was reached.
[03:24] here, and the target of 1000 points was reached. And in sales, how will this strategy work? It's very simple. Look, I'll need the price to be below the two averages. As you can see here, I have an
[03:37] average of 50 and an average of 200 here. And the price is below both averages. Yes, this is the perfect sales scenario. To confirm a sell entry, I need the price to close below the bottom line on Bing. This has to
[03:51] happen starting at 10:00 AM. This is shown on the 15-minute chart of the can see that we have this little candle here, look. The 10-period candle is closing below the lower Biger line, as you can see. And he's below both
[04:06] averages. This is a simple and perfect sales condition. From the moment that candle closes, he enters a sell position at the opening of the next candle a sell position at the opening of the next candle with a 300-point stop-loss target of 1000
[04:19] with a 300-point stop-loss target of 1000 points, right? stop, he will simply wait for one of those orders to be executed. In this case,
[04:32] one of those orders to be executed. In this case, the target was hit, and he will perform more operations if he receives the signal again before 4 PM. This is shown on the 15-minute chart of the futures index. Following the model
[04:45] capital curve formed here since 2015. See it here? The start date is here and we have the end date here, look. We've had around 10 years of backtesting here. Upward-sloping capital curve . These were the statistics
[04:58] . We had 2700 operations cataloged in that backtest. Just a reminder that what I'm doing here is backtesting, right? This is a test of past strategies. Look, we had a profit factor of 1.28 and a
[05:13] hit rate of 31.81% with a high payoff of 2.73. It's almost reaching a ratio of three to one. A low dodal of 6.84%.
[05:26] And here you have the chart of the operations. You can see from this You can see from this chart of operations that when this strategy is successful, it wins a lot. When she loses, she loses very little. And it's possible
[05:39] to modify this. And that's what I want to do with you now. But if you like, subscribe to the channel, and turn on always be notified when we bring you some
[05:51] interesting backtesting. Look what we can do here. We can modify the target. For example, look, if I set a target of 1500 points and execute, you'll see that we'll have a modification in the capital curve,
[06:03] because I'm increasing the target of the strategy, but it remains profitable and very interesting. Look, it's still working, can you see? And look, working, can you see? And look, we had a payoff of 3.20, it was
[06:16] three to one. At various times it will appear that the capital curve is not rising. Look, you have moments of sideways movement here, but in the long run, the setup will move up the capital curve because of this excellent
[06:30] risk-return ratio. Look, the DRDAL is low at 7.86%. We can make other changes. Just look what would happen if we set find out. Look, I'm going to run it again so we can see. Look, with a
[06:44] target of 2,000 points, we obtained these statistics here. You can see that the payoff hasn't increased much; it's still at 3.39, and the at 3.39, and the access rate is at 27.69%. This is the
[06:57] capital curve, with a target of 3,000 points and a stop loss of 300 points. Let's test it here. Just look. And it turned out quite interesting as well. You can see that the capital curve continues to rise because it's a really good setup
[07:10] and it's showing these numbers, right? Very interesting. You realize that it's even possible to get up to 3,000 target points there. And we're going to make some adjustments here. For example, let's set a shorter stop loss. Since we're entering a market and the
[07:23] target is quite far off, backtesting can handle that well. So I'm going to put here, for example, a stop loss of 200 points so we can see how it looks. I'm using a target of 3,000 points and a stop loss of 200 points. Let's see
[07:36] how this capital curve looks. Look at that! The capital curve is steeply upward sloping. That's interesting, isn't it? The capital curve is rising, so I'm using a very tight stop loss with a very long target, five to one. It has a
[07:49] risk-reward ratio of 5 to 1. It has a payoff of 5.28. It has a 20% success rate, but the payoff is too high. Look at this! The capital curve is extremely interesting, isn't it? Using a very
[08:04] short stop loss with a very long target. A very long target. target has been hit, right? In this case, the target was hit, and there are several
[08:18] strategy has a low success rate. But look at the relationship here. Here's the chart of the relationship here. Here's the chart of the operations.
[08:31] for us to see. Let's see how it goes. I have a stop loss of 100 points and a target of 3,000 points. And I'll see how this turns out. Look at that! There you go
[08:48] very short stop loss. And the payoff is 11.11.45. 11.11.45. The payoff is 11.45. The payoff is 11.45. After 3,193 operations with a
[09:00] success rate of 10.40%. The success rate is pretty low, isn't it? But look at this! When he loses, he loses very little. When he wins, he wins big. Let's do the following now. Let's do the opposite. I'm going to set a
[09:15] Let's do the opposite. I'm going to set a target of 30 points, modifying it for scalping. Right? Now we're going to test it in a scalping format to see how the strategy works. Oh, it ended up like this
[09:30] . You realize it didn't look good in the scalp format. It didn't turn out well . Despite having a 93% accuracy rate here, the payoff was terrible and the
[09:42] capital curve was very bad. So you can clearly see that this is a setup that works in a traditional way, using, for example, a target of 3,000 points and a stop of 300 points, in the way I showed
[09:55] Receive the channel's various strategies. [Music] There are dozens of open-source codes that you can use freely in your profit chart. Enroll today and receive, in addition to various setups, complete training teaching you step-by-
[10:09] step how to create strategies in the Profit Chart editor. And best of all, when you enroll, you get access to our support group, where we share various codes and create several strategies
[10:22] based on your feedback. Do you need to program a [music] setup and don't know how? Through our support service, we create the code for you. [music] Enroll today and get access to all of this today.
[10:35] We share the setups with 100% open source code. [music] You can request an unlimited number of codes throughout the two months of support. You set up various trading systems [music] and obtain statistics to
[10:50] discover winning strategies. A training [music] designed to teach traders to be more than just ordinary investors, but developers of new ordinary investors, but developers of new strategies for the stock market.


⚡ Saved you 0h 11m reading this? Transcribe any YouTube video for free — no signup needed.