
Why 95% of traders fail (indicators are useless)
45sChallenges common trading beliefs and promises a contrarian insight, sparking curiosity and debate.
▶ Play Clip"Delivers on the promise of explaining divergence as a trap, but padded with a lengthy intro and self-promotion."
This video analyzes the concept of divergence in trading, arguing that it is a trap set by market makers. The presenter explains that while retail traders use divergence as a buy or sell signal, smart money uses it to lure the masses into wrong positions, creating liquidity for their own trades. The video advocates for a deeper understanding of market mechanics, focusing on liquidity and balance rather than indicators.
The video introduces the topic of market maker traps and false divergence, suggesting that most traders rely on indicators without understanding the real reasons behind price movements.
Price moves due to liquidity and rebalancing, not because indicators show oversold or overbought conditions. Indicators are based on historical data and do not predict future liquidity.
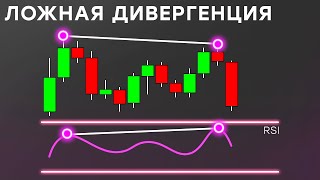
Divergence is a discrepancy between price and an indicator. A divergence at the top is bearish, at the bottom is bullish. Classic bullish divergence: lower low on price, higher low on indicator.
Retail traders use divergence as a buy/sell signal without understanding pricing. This is based on teachings from books and courses, like the four conditions: overbought with bearish divergence for short, oversold with bullish divergence for long.
If it were that simple, everyone would make money, but over 95% of traders are unprofitable. Divergence can be used to assess mass sentiment.
For the masses, a bullish divergence is a strong buy signal, but for smart money, it's a sign that a correction may begin. The price will seek liquidity for buying and fill bearish balance.
Hidden divergence occurs when price makes a higher high but indicator makes a lower high (in an uptrend) or vice versa. It indicates trend continuation.
In a bearish market, a classic bullish divergence appears before a correction, luring traders to buy. Then a hidden divergence may form, confirming the downtrend continuation, and you can open a short position.
Market makers understand the thought processes of retail traders. They entice the masses to open positions in the wrong direction, creating liquidity for themselves.
Price consolidates near an old maximum, forming a double top with bearish divergence. Retail traders short, but the price breaks above, trapping them. The old high is a target for liquidity.
Divergence should be used as an indicator of mass sentiment. When a classic bearish divergence appears, a short position may work for a small drop, but the main target is smart money.
Smart money does not look at indicators; they look at where stop losses are. They remove liquidity from old highs, enticing traders to open wrong positions.
In a bull market, classic bearish divergence appears before a correction, luring traders. Hidden divergence appears before trend continuation. This pattern repeats in any market.
To be profitable, move away from the concepts used by the masses, as 95% are unprofitable. Learn to see smart money traces on the chart.
The video concludes that divergence is a tool used by market makers to trap retail traders. To succeed, traders must understand liquidity and balance, and use divergence as a sentiment indicator rather than a direct signal.
What is divergence in trading?
A discrepancy between price and an indicator, where a divergence at the top is bearish and at the bottom is bullish.
01:17
What is a classic bullish divergence?
When a lower low forms on the chart but a higher low on the indicator.
01:45
What is a hidden divergence?
When price makes a higher high but indicator makes a lower high (in an uptrend) or vice versa, indicating trend continuation.
04:12
According to the video, what is the primary driver of price movement?
Liquidity and rebalancing, not indicators.
00:33
What percentage of traders are unprofitable according to the video?
Over 95%.
02:44
How should divergence be used according to the video?
As an indicator of mass sentiment, not as a direct buy/sell signal.
08:21
In a bearish market, what does a classic bullish divergence indicate?
A potential correction upward, luring traders to buy, but the trend may continue down.
04:25
Price Moves Due to Liquidity
Challenges the common belief that indicators drive price, emphasizing liquidity as the true driver.
00:3395% of Traders Unprofitable
Highlights the ineffectiveness of indicator-based trading for the majority.
02:44Market Makers Understand Retail Thinking
Explains how smart money exploits retail behavior to create liquidity.
05:32Divergence as Sentiment Indicator
Provides a practical alternative use for divergence, shifting from signal to sentiment analysis.
08:21Move Away from Mass Concepts
Encourages traders to adopt a contrarian mindset to avoid the fate of the 95%.
11:11[00:02] in this video we will analyze the market maker trap and false divergence. Most of the market trades based on indicators and cartridges simply because these are simple things that do not need to be delved into
[00:17] when they open trades based on this they do not need to know anything about pricing and the real reasons why the price moves up or down. We do not focus on this when analyzing the chart and trading because the market does
[00:33] not work like that. The price will not move up if the ersai shows oversold [ __ ] divergence, although this would be very simple and convenient. Violation of transactions will gradually deprive you of your deposit, and given that the masses
[00:49] consider their liquidation as a stop loss, this can happen much faster. The price moves up or down only because of liquidity and to rebalance the price. Indicators are based on history, they
[01:04] measure the past with certain calculations, mathematically compressing all the data, and the result would be yours. This has nothing to do with where the liquidity is and where the price will move next.
[01:17] Before we continue, I recommend subscribing to my I write about trading analytics and market thoughts on my Telegram channel. You'll find a lot of useful and
[01:29] trader. Follow the link in the description below the video. We'll talk about divergence. Divergence is the discrepancy in price between chart indicators. If you see a divergence at the top, it will
[01:45] always be a bearish divergence. If it's at the bottom, it's considered a bullish divergence. The chart shows a classic bullish divergence. This is when a lower low forms on the chart, but
[01:59] on the indicator you see a higher low. For retail traders, this is a buy signal. Traders who trade based on such signals have no thought
[02:13] signals have no thought processes or knowledge about pricing. This was instilled in them through books, seminars, courses, and Bruce, who said that indicators are controlled, but that to open a trade, you need to consider the Turk's four conditions:
[02:29] overbought and bearish divergence for opening a short position, and oversold with bullish divergence for opening a long position. These are the four opening a long position. These are the four conditions on which they trade.
[02:44] If it were that simple, everyone would just make money. We know that more than 95 percent of traders are unprofitable. I based on the signals the indicator gives. We'll talk about how you can
[03:01] use divergences to assess mass sentiment or how they think about price. When for the masses, such a divergence is a strong signal to buy, for us, it's a sign that a correction may begin here.
[03:17] The price will strive for liquidity for buying and for filling the bearish balance, where a better opportunity for us to open a short position will appear. We will consider this pricing
[03:31] from this side because, based on the higher timeframes, because, based on the higher timeframes, we are bearish and expect to remove the shameful barks about liquidity in the 37,000 range.
[03:46] timeframe, and therefore I recommend watching it for a deeper understanding of watching it for a deeper understanding of the material. Look at the tips, we'll understand,
[03:58] and so there is another hidden agency. classic one. It doesn't go beyond the limits, and I have a correction in time, that is, a logo high is formed.
[04:12] But on the indicator, everything is the opposite, you will see that here A higher high was formed, will see that here A higher high was formed, hidden divergence. When you work with a chart with a
[04:25] descending urfu, that is, you have a bearish bias based on higher timeframes, then the use of divergence will occur in this way: when a classic bullish divergence appears, when liquidity is withdrawn for
[04:40] sale, the price may begin to correct upward. If this happens, then you wait for the activation of a stop loss for a purchase above the old how it is from your zone of interest. At this point, a hidden divergence may be formed,
[04:54] At this point, a hidden divergence may be formed, which will give you additional confirmation that the downward price formation will continue. Here, you can consider opening a
[05:06] position in a downward direction because, based on higher timeframes, because, based on higher timeframes, you expect the asset valuation to be even lower at the same time. 3 dori who opened a long position based on a classic
[05:19] bullish divergence will be knocked out of the market. The logic is simple. If you have a bearish market, then classic customary divergence usually appears when a correction begins,
[05:32] but hidden divergence can be It will be seen before the continuation of downward pricing. You need to focus on it. When ritual traders look at the price, they see what they want to see. Usually, their
[05:48] assumptions are based on indicators and cartridges. If they see a bullish divergence, they open a breaking position. They see an upward trend. They would do the same. Market makers, in turn, understand the
[06:03] thought processes of market participants about price. They entice the masses to open positions in the wrong direction, thus creating new liquidity for themselves, thus creating new liquidity for themselves,
[06:16] fill their orders. We must look at where liquidity We must look at where liquidity can be created and neutralized. To do this, we need to understand how the majority of the market thinks and do everything
[06:28] absolutely the opposite in order to be profitable. Let's look at my brother-in-law's example. Here you can see that the price is consolidating near the old maximum for a larger segment of the market. It acts as a
[06:43] resistance level from which it will be relevant to consider a short position. A double top with a bearish divergence was also formed.
[06:56] indicate that it is necessary to short. I think many of you would do absolutely the same as the main part of the market. The part of the market. The main reason for such a mistake is False
[07:09] prioritization if you opened a short position here chart indicator and pattern, but they need balance and liquidity there is a key difference
[07:24] the direction of your thought processes in the right direction you will still direction constantly getting trapped the price will not leave this maximum untaken and the balance filled with it is greater than it
[07:42] because this is the primary target for an upward movement this is typical pricing before removing a significant plo liquidity for buying the price moves in the opposite direction to
[07:54] use liquidity for selling to create new liquidity for buying or balance the price you saw bearish patterns divergence in the range of the old x will not at all mean that the bull market is
[08:07] over if you do not take into account the context then most likely you will fall into a trap and open a position in the wrong direction divergence patterns should be used as an indicator of
[08:21] mass sentiment and here when a classic bearish divergence appeared, a short position was opened and the price really began a slight drop down but ask yourself how many people
[08:34] but ask yourself how many people will exit their positions before The reversal is an insignificant part of the scalper, which is of no interest, but the funds that are the main target of smart money are guaranteed
[08:48] to open positions with much more ambitious goals, trap. This is all due to the fact that the priorities in chart analysis lie on indicators and patterns. The crowd
[09:01] believes in what it wants to believe. This is a myth that has nothing to do with pricing. Smart money does not look at the ersai; they are interested in where the
[09:15] they are interested in where the stop loss is for buying and selling. Here you see that before removing liquidity from the old high, the price moves in a downward direction, thereby enticing traders to open
[09:28] positions in the wrong direction. Liquidity for sale is removed from the short-term high and the balance
[09:43] and there is no such pump. Liquidity for purchase acts as liquidity for the purchase, with the help of which the asset is assessed. For each high, traders left their stop losses, relying only on insignificant factors for the price.
[09:58] Before the asset markup, you had the opportunity to open a long position. You, of course, relied on your own When analyzing significant factors such as liquidity and [music], you may also have noticed a hidden
[10:13] divergence, which confirms that the trend will confirms that the trend will continue. Let's simple rules to remember. In a bull market, a classic bearish
[10:28] divergence will appear before a correction, so most of the market is lured into opening positions in the wrong direction. Naturally, not only with the help of this indicator, but this is one of the components.
[10:44] You will see hidden divergence before the continuation of the upward trend. Focus on it. Such pricing is Such pricing is absolutely always repeated in any market,
[10:57] and this shows phenomenal results. In both cases, which I just In both cases, which I just showed, I opened a position. You need to move as far as possible from the idea and concept that is used by
[11:11] the masses simply because 95 percent of them are unprofitable. Learn from the visible part of things that a small group of traders does, which we call smart money,
[11:24] leaving traces on the chart. When you gradually begin to develop more and more and see some signals and signs of smart money in the market.
[11:39] liked it. Like and comment And don't forget to subscribe to my Telegram channel. Link in the description.
⚡ Saved you 0h 12m reading this? Transcribe any YouTube video for free — no signup needed.