
What is Liquidity?
60sClear, fundamental explanation of a key trading concept that appeals to beginners and is highly shareable.
▶ Play Clip"Delivers solid theory on liquidity but padded with repeated examples and a plug for the Telegram channel."
This video explains the concept of liquidity in trading, focusing on how smart money (banks and large institutions) uses liquidity pools to manipulate price movements. The presenter provides a theoretical foundation and practical examples to help traders identify high-probability setups by following smart capital's actions.
Liquidity is the ability to quickly buy or sell assets without significantly affecting price. It is created by market participants through opening positions and placing pending orders.
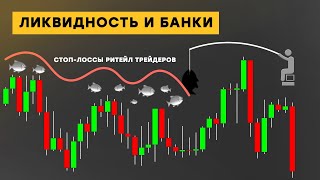
About 90% of traders place stop-losses behind the nearest minimum (for longs) or maximum (for shorts), creating liquidity pools that smart money targets.
Liquidity for sale forms below each minimum, created by stop-losses of long positions and breakout shorts. This is used by smart capital to fill sell orders.
Liquidity for purchase forms above each maximum, created by stop-losses of short positions. Smart money uses this to fill buy orders or to mark up the asset.
Liquidity for sale is below each minimum, and liquidity for purchase is above each maximum.
Smart money uses large volumes and algorithms to control price movements, constantly searching for liquidity to fill their orders (opening, increasing, or closing positions).
Before significant upward movements, smart capital often drives price down to take out liquidity below swing lows, allowing them to accumulate long positions at better prices.
The best long positions are opened when liquidity for sale is withdrawn; otherwise, there is a high probability of being stopped out.
Consolidation under a liquidity pool is normal after smart capital has reaccumulated its long position; growth begins to remove liquidity from the opposite side.
Buying liquidity can be used to lock in profits from long positions or to further mark up the asset.
Smart capital returns price to ranges to balance inefficient pricing and close unprofitable short positions, often using liquidity for sale.
Further markup occurs due to stop-losses above piggy banks, moving price higher and providing profit to smart capital while leaving traders with losses.
In real estate, smart capital uses liquidity for purchase to open or increase short positions, often with manipulative moves before significant declines.
The market falls or rises to restore balance in weekly inefficiencies and to activate stop-losses, which are the two true reasons for price movements.
Before exiting a range, price often returns to premium market to fill bearish balance and activate stop-losses, creating liquidity for shorts.
For long positions, focus on liquidity below the minimum of the previous month, week, day, and equal lows. For shorts, focus on liquidity above the maximum of the previous month, week, day, and equal highs.
Combine multiple factors: quick bias from higher timeframes, testing zone of interest, discount/premium prices, confirmation of decline, and additional factors like divergence.
Smart money buys at discount (below 50% of range) and sells at premium (above 50%). For longs, look for price behavior in discount market.
Divergence between correlated assets (e.g., Bitcoin and Ethereum) and hidden RSI divergence can increase the likelihood of a setup working.
In a two-week sideways range, equal lows and highs formed liquidity pools. Price did not reverse immediately after updating the upper boundary; it continued to premium to fill inefficiency.
A false pump at the beginning of the week, withdrawing liquidity for purchases and testing zones of interest, often leads to downward movement in coming days.
For shorts, place limit orders at the beginning of a bearish imbalance above the high of the candle; conservative stop-loss behind the high, aggressive on the second or first candle of formation.
Price updating equal highs in premium market and filling bearish daily imbalance provides a zone of interest for short positions; wait for confirmation on lower timeframes.
Take profits when equal lows are updated at the lower range border; after filling the former imbalance, a reversal is likely.
Understanding liquidity is fundamental to trading. By identifying where liquidity pools are formed and how smart money manipulates price to use them, traders can open more informed positions. The presenter emphasizes combining multiple factors and backtesting before applying the theory on a real account.
What is liquidity in trading?
The ability to quickly and easily buy or sell assets without significantly influencing their price.
00:47
Where do about 90% of traders place their stop-losses for long positions?
Behind the nearest minimum.
01:19
What creates liquidity for sale?
Stop-losses of long positions and breakout shorts below minima.
02:18
What creates liquidity for purchase?
Stop-losses of short positions above maxima.
03:05
What are the two true reasons why the market falls or rises?
To restore balance in weekly inefficiencies and to activate stop-losses.
09:28
What is the best time to open a long position according to the video?
When liquidity for sale is withdrawn.
05:18
What are the key liquidity pools to focus on for long positions?
Below the minimum of the previous month, week, day, and equal lows.
11:22
What is the significance of testing the zone of interest?
It is a trigger for price; after removing liquidity, a test of the support zone confirms the setup.
13:15
What are the additional factors that increase the likelihood of a setup working?
Divergence between correlated assets and hidden RSI divergence.
14:27
What is the recommended stop-loss placement for a short position in the example?
Conservative stop-loss behind the high; aggressive on the second or first candle of formation.
16:05
Liquidity Pools Summary
Provides a clear rule: liquidity for sale below each minimum, liquidity for purchase above each maximum.
03:32Smart Money Manipulation
Explains how smart capital uses liquidity to fill orders, a core concept for understanding price movements.
04:18Two True Reasons for Market Moves
Distills market movements into two fundamental causes, simplifying analysis.
09:28Key Liquidity Pools List
Provides a practical checklist of liquidity pools to monitor for high-probability reversals.
11:22Discount and Premium Markets
Highlights the principle that smart money buys at discount and sells at premium, guiding entry decisions.
13:45[00:02] today's video is dedicated to the most important topic of liquidity, this is the basis of any market and, having mastered the basic theory, you will already be able to identify the actions of smart capital and follow it when opening your positions, understanding the logic of
[00:18] price movements will change your perception of the market and approach to analyzing any chart, as a result, the quality of the positions you open will increase significantly. Before starting to analyze the topic of today's lesson, I recommend subscribing to my
[00:33] telegram channel here I write about trading analytics and thoughts on the market, in it you will find a lot of useful and interesting information for yourself, like Tridra, follow the link in the description under the video. What is liquidity? It is
[00:47] the ability to quickly and easily buy or sell assets without significantly influencing their price. It is created by market participants when opening a position and placing pending orders. I will give an example: traders make a decision to buy
[01:03] based on their arguments. This could be a test of a significant support zone of a trend line or a breakout. In addition, there may be a bullish divergence or something else in principle. For us, this is not so important, what we are interested in is understanding where the orders will be
[01:19] placed. Stop-loss about 90 percent of traders do not differ from each other in the location of the stop-loss, they will place it behind the nearest minimum. And what happens here with green arrows, I conditionally showed where the
[01:34] main part of the position was opened in the current range. Here, purchases occurred during the breakout of the previous maximum. During this correction, the local support zone was tested. And here, an upward trend test occurred. And
[01:48] here, equal minimums were formed. What provoked traders to buy, considering this a strong support level. positions will be linked by the location of the stop-loss at one level.
[02:04] semi-liquidity for sale is formed, which will be used by smart capital for its purposes. We will talk about this in detail further. It is worth noting that liquidity for sale is formed not only when opening transactions in an upward direction
[02:18] when the price will update equal minimums. What happened on this candle? Traders trading on a breakout will open a short position. These are the same sell orders as stop-losses of previously opened Long positions.
[02:33] As for the second part of the chart, such semi-liquidity for sale was formed on it. These are the nearest minimums for which traders placed their Protective stops with reopening of a Long position. Arrows show where the
[02:49] bulk of purchases were made. Everything is the same as in the first example. In addition to liquidity for sale in the market, there is also liquidity for purchase. It is created by stop losses of traders opening a short position. When opening
[03:05] a deal in a downward direction, the masses will place their orders to buy will place their orders to buy above the nearest maximum on the chart. I conditionally showed the places where such deals were opened and where the Stop Loss was placed.
[03:17] This creates pull liquidity for purchase, which will be used by smart capital for the purpose of further markup of the asset or for forming a short position. asset or for forming a short position. Well, if we summarize the intermediate results, then
[03:32] pull liquidity for sale is formed below each minimum, and the liquidity floor for purchase is above each maximum. How Smart Money Uses Liquidity. As you already know from previous videos, I proceed from the fact that Smart Money,
[03:48] using large volumes and unique algorithms, controls every price movement. They are constantly searching for liquidity in order to fill their art - a fractional purchase or sale, this can be an opening, an increase in the volume of a
[04:03] can be an opening, an increase in the volume of a previously opened position, or its closing. Traders like us You are not interested in smart capital, we are too small in monetary equivalent, the main goal is funds. They are the ones that create
[04:18] the large liquidities that smart capital needs to fill its assets. Now we will analyze how smart capital's long positions were overaccumulated in the current sideways trend, and to avoid confusion, I will
[04:32] manipulations. Pay attention to this aggressive downward movement. With its help, smart capital reaccumulated its long position due to liquidity for sale below the marked swing. This manipulation,
[04:49] which occurs before every significant upward movement, smart capital discounts the asset or allows the price to fall to certain values in order to use all available liquidity to fill
[05:02] its buy orders, after which the asset will be marked up in order to make a profit from open long positions. Our main task as a trader is to follow the actions of smart money. The best long positions can
[05:18] only be opened when liquidity for sale is withdrawn, otherwise, with a high probability, you will become liquid. I want to note that the price in most cases activates a stop loss even without fixing the body of the candles below the updated
[05:31] fixing the body of the candles below the updated swing, as happened here. But This is not a factor to be taken into account. Much depends on the context in which this occurs and the timeframe you are using.
[05:45] Consolidation under a liquidity pool is normal. This pricing trades after smart capital has reaccumulated its Long position. Growth will begin in order to remove all
[06:00] available liquidity from the opposite side. Buying liquidity can be used for two purposes: to lock in profits from a previously opened Long position or to further markup the asset using it.
[06:15] further markup the asset using it. After updating this maximum, the price did not continue to rise and a correction began. We can conclude that the stop loss on a buy above it was used to partially lock in profits. Long positions.
[06:30] Smart capital needed to return the price to this range in order to balance the inefficient pricing that arose as a result of the asset markup and also in order to close its unprofitable short position. Where did we even get
[06:44] the deal in a downward direction? And why close it? Let's return to the previous manipulation. Here, smart capital sold to deliver the price below the marked Lows in order to react to its Long position and now, in order to
[06:59] continue to markup the asset, it needs to close markup the asset, it needs to close its As you already understand, this requires liquidity for sale, which was formed under
[07:11] this. This, of course, does not exclude the fact that in parallel, the volume of the previously opened Long position will not increase after this manipulation, equal highs were formed and the same thing happened as
[07:25] in the first example, a correction began, during which another short position was closed. How will a further markup of the asset be produced? This will occur due to stop losses for the purchase located above the marked piggy
[07:40] bank. They will move the price even higher, providing profit to smart capital. Traders will be left with unprofitable positions. Now look at how this positions. Now look at how this looks
[07:57] general market Smart money uses liquidity for its own purposes, this is relevant liquidity for its own purposes, this is relevant for all markets and timeframes. Now we will analyze how smart capital uses liquidity in the real estate market to
[08:09] open or increase the volume of their short positions. Smart capital needs liquidity for purchase, therefore. Before each significant downward movement, we will see a manipulative movement in the opposite
[08:22] direction. Which will give us the opportunity to open high-quality transactions. In the first example, the maximum of the previous month is updated.
[08:34] which was used by smart capital to fill its Art exactly for selling, that is, in this area, the main volume of short positions was filled. This occurred in the premium market when 50 percent of the bearish
[08:48] balance was filled, which served as a trigger point. To begin an aggressive decline, the asset was marked down due to large pools of liquidity for sale that were formed under each piggy bank during this slow growth. In this
[09:02] way, smart capital ensures a profit on a profit on a
[09:28] after which growth begins to restore balance in the weekly ineffectively and to activate a stop-loss. These are the two true
[09:40] reasons why the market falls or rises. Smart money sold in the premium market above this maximum, using liquidity for buying to increase the volume of its short position. The initial target for the asset markdown
[09:55] will be the minimum from which the stop-loss of traders who opened long positions began to grow, which will provide an opportunity to lock in profits on previously opened trades. The final manipulation. Before exiting this range, the
[10:09] same scenario occurred: the price returned to the Premium Market to fill the bearish balance and activate stop losses. After updating this maximum, a small consolidation began before the opening of a new month, which, on the one hand, involved
[10:24] manipulation of highs, and on the other hand, a large amount of semi-liquidity for sale was formed. Smart money used liquidity to buy above each updated maximum to open their short positions. And liquidity for
[10:39] sale. To ensure a profit on these positions, because it was due to it that the asset markdown was carried out. I hope that after the examples shown, it has become clearer to you how smart money uses liquidity and profits, and in a
[10:54] bearish market, we will further discuss how to effectively use this when opening your trades. As you already know, there is liquidity above each maximum and minimum, but opening your positions after updating a
[11:08] random swing will not make any sense, so now we will analyze. For which Semi-liquidity you should focus on first and foremost and what factors besides the withdrawal of liquidity you need to consider in order to trade effectively. On the
[11:22] right side, you can see the list of the Pool in liquidity, the withdrawal of which will provide you with a high probability of a price reversal or the beginning of a correction. We will be interested in considering long positions below the minimum of the previous month,
[11:36] positions below the minimum of the previous month, week of the day, the minimum of the day and equal layers. There is also a sixth point. The old minimum is a symbol that can be called any pig. This can be an internally effective quarterly or
[11:50] annual minimum. In general, the extreme below which huge semi-liquidity is formed is obvious to all market participants. There is a similar list below. Only now there is a floating liquidity for buying. When they are withdrawn,
[12:05] there is a high probability of a reversal. Prices, accordingly, are your opportunity to open a short position. On the left side, you can see the criteria for a highly probable setup. Systematic profitable trading cannot be
[12:18] based on only one instrument, therefore, we must combine many factors presented on the chart and analyze their relationship. Thanks to this, you will be able to open high-quality transactions on a regular basis. The
[12:32] first is quickly biased because by analyzing higher timeframes, you can analyzing higher timeframes, you can determine the future direction of the price in If, for example, the daily and four-hour timeframe indicates a
[12:45] potential premium for an asset, then after updating the previous day's minimum, it will be relevant to look for a second liquidity withdrawal position. I just explained this if you are set up for bullish trades, then when removing the lows
[13:00] that are on this list, you need to look at the lunt position. 3. Testing the zone of interest is a crucial element that many neglect, which is why they themselves become liquid by opening positions too early. You should always see a
[13:15] test of the support zone after removing liquidity for sale. This is a trigger for price, for example. Here, in addition to updating the previous month's minimum, we want to see the reason why the fall becomes lower at these values than the updated
[13:31] minimum. There may be a greater imbalance that will be filled before the start of growth. In this case, it will be relevant to consider a long position. Further, I will show all this with examples. Point 4. Discount prices. Smart money
[13:45] will always strive to buy at a discount in the discount market and sell at a premium in the premium market. Therefore, for purchases, we are always interested in the price behavior in the discount market below 50 percent of the trading range.
[13:58] Here you can see an example with updating the minimum of the previous week. This will be a good one. Opportunity for purchases If the first and third points are still observed, the fifth point is confirmation of a fall, I mean the amount of a descending
[14:13] structure on lower timeframes after testing the zone of interest, this will give us an understanding that smart capital is really going to produce an asset premium after removing the liquidity pool. I will show this in more detail with examples.
[14:27] Well, additional factors that will increase the likelihood of your setup working out are divergence between assets that correlate with each other, for example, between Bitcoin and Ethereum, and hidden divergence in RSI.
[14:43] To find a short position, we will be interested in the same set of factors. Hello. In this example, you can see that the price after a downward impulse traded sideways for about two weeks.
[14:55] During this time, significant liquidity pools were formed on both sides, equal lows below and equal highs above, which were primarily removed. As you can see, the price did not reverse immediately after updating the
[15:09] upper boundary of the range, it continued to move above the premium market. To fill ineffective pricing above this old High, this is the first problem area. Where could the price reaction be expected? The reversal
[15:24] occurred after Monday's opening and the withdrawal of the previous week's price. Similar pricing is very common at the beginning of the week. A false pump, during which liquidity is withdrawn for purchases and zones of interest are tested, usually
[15:39] leads to the price moving downwards in the coming days. had the first opportunity to open a short position with a stop-plus for the nearest
[15:51] swing. You could also enter a trade after confirmation on lower timeframes. During the noise, a bearish imbalance should form in the ascending structure, which will act as your zone of interest.
[16:05] From where you can open your position, a limit order to short can be placed at its beginning above the High of this candle, and a conservative stop-loss will be placed behind the High. Where the decline began, an aggressive stop-loss option in order to
[16:20] increase the risk-reward ratio is placed on the second or is placed on the second or first candle of the formation. Balance is further. You can see several more similar opportunities for opening a Fort position. The
[16:35] following example will be the price updating equal highs in the Premium Market and filling the bearish daily imbalance. What will be our zone of interest for opening a short position? You don't have to make decisions right away while the price
[16:49] is within the imbalance. You can go to the junior level to wait for confirmation of the future asset markdown. And then open a short position. Profit taking on open positions should occur when equal
[17:03] layers are updated at the Lower Range Border. After filling the former imbalance, a high probability of a reversal will appear below them, that is, an asset markup will begin, and it will be relevant for us to watch. Hello. Today I told only a
[17:18] small part of what the topic of liquidity is. This is a basic theory with which you can open informed trades, understanding the reasons for some price movements in the future. If there is demand for this, I
[17:32] made a second part on this topic. Where the topic of liquidity will be deeply analyzed with all the nuances. Before applying the acquired knowledge on a real account, I recommend conducting a back test. Learn how to use this theory, taking into
[17:46] account all the necessary factors and make sure it works. Most of the examples you saw today I traded in real time and all this was publicly broadcast on my Telegram channel. In it, you can see how
[18:00] effectively the concept works and everything I talk about here. But only in real time. Follow the link in the description and subscribe. Well, if you learned something new today and you liked the video, then like it and
[18:14] write a comment because it will greatly help promote this video.
⚡ Saved you 0h 18m reading this? Transcribe any YouTube video for free — no signup needed.